

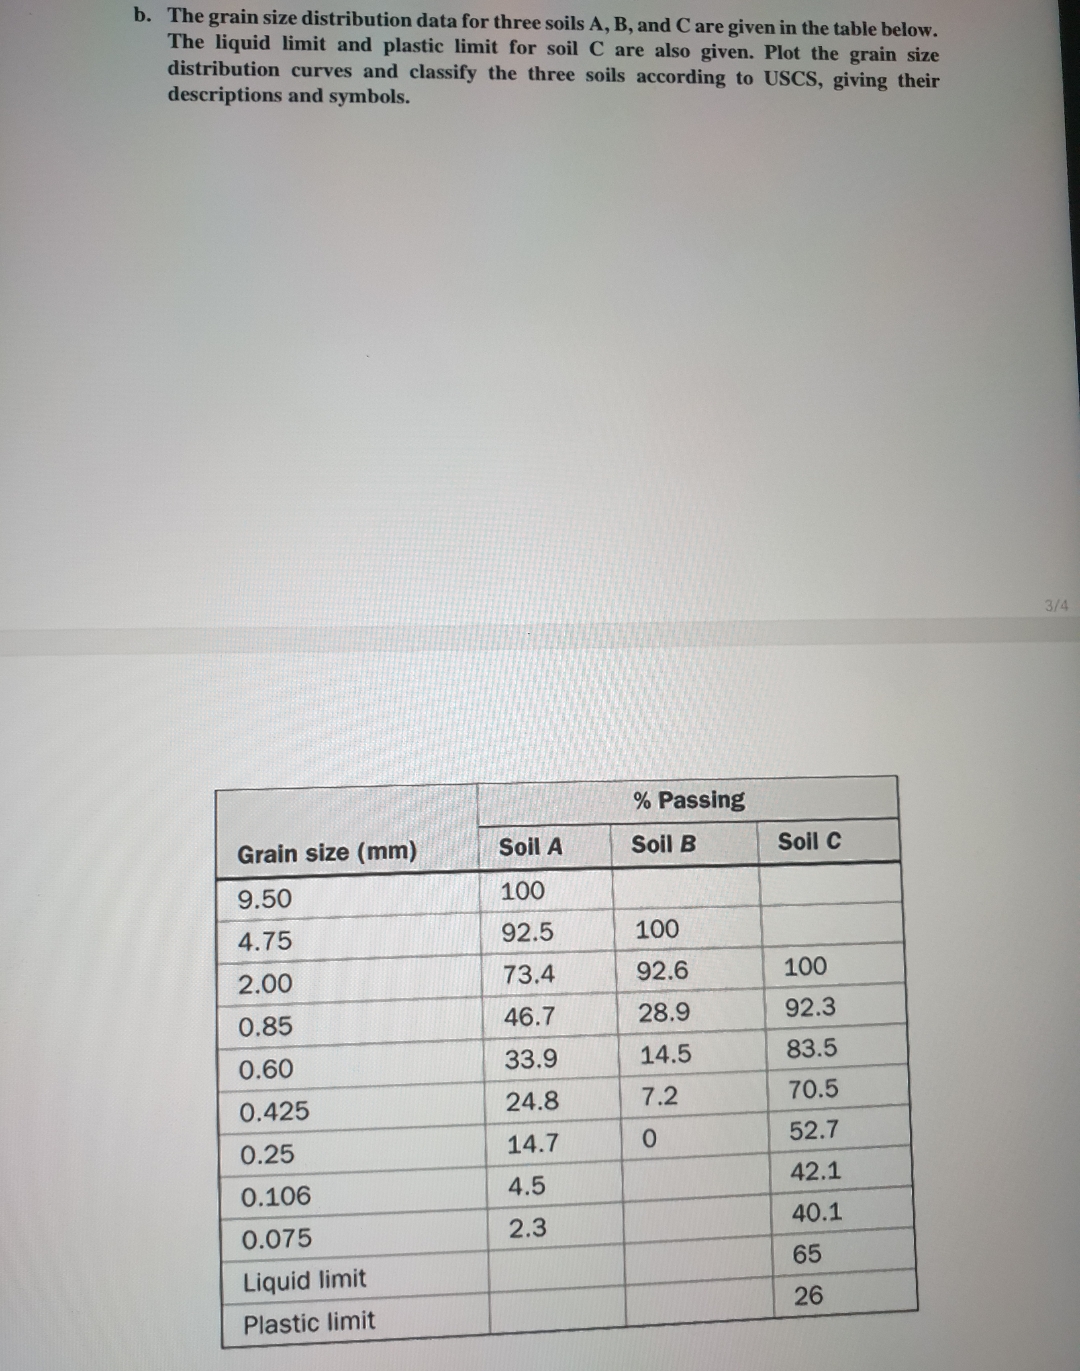
Question: b . The grain size distribution data for three soils A , B , and C are given in the table below. The liquid limit
b The grain size distribution data for three soils and are given in the table below. The liquid limit and plastie limit for soil are also given. Plot the grain size distribution curves and classify the three soils according to USCS, giving their descriptions and symbols.
tableGrain size PassingSoil ASoil BSoil CLiquid limitPlastic limit
Step by Step Solution
There are 3 Steps involved in it
1 Expert Approved Answer
Step: 1 Unlock

Question Has Been Solved by an Expert!
Get step-by-step solutions from verified subject matter experts
Step: 2 Unlock
Step: 3 Unlock