

Question: b) The rectangles in the graph below illustrate a ? The value of this Riemann sum is v Riemann sum for f(a) = and this
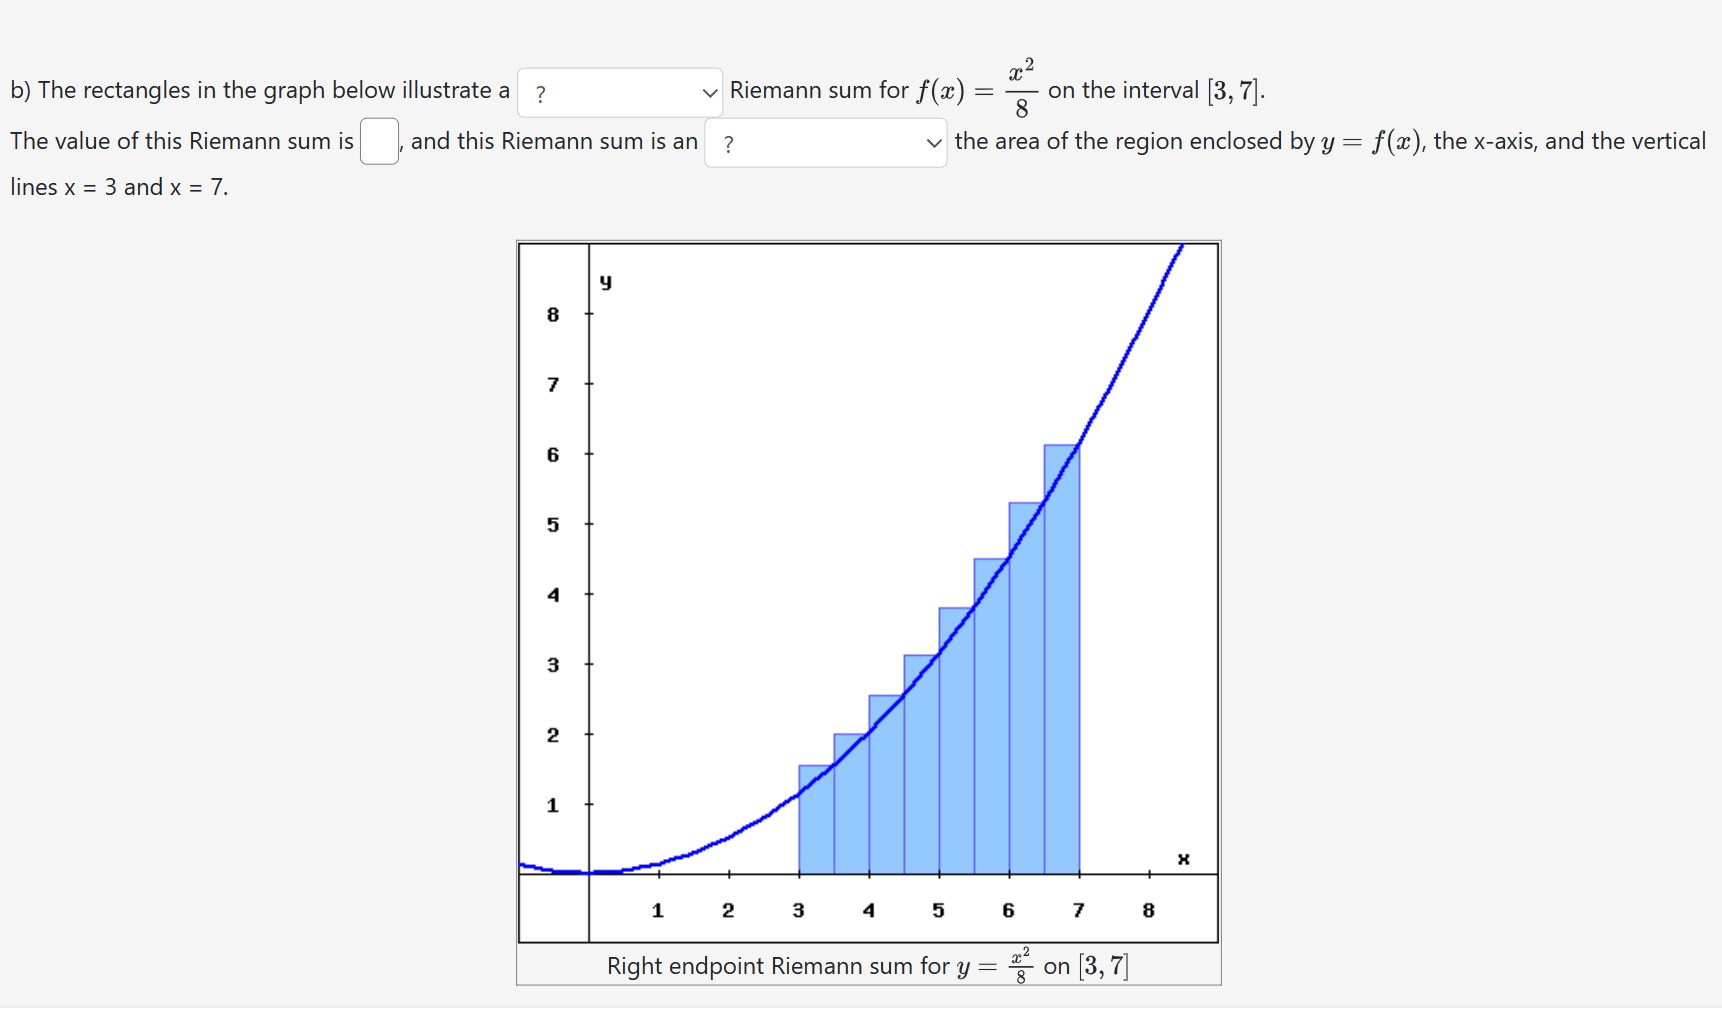
![and this Riemann sum is an 8 on the interval [3, 7].](https://s3.amazonaws.com/si.experts.images/answers/2024/06/6663867493728_51666638674752a1.jpg)


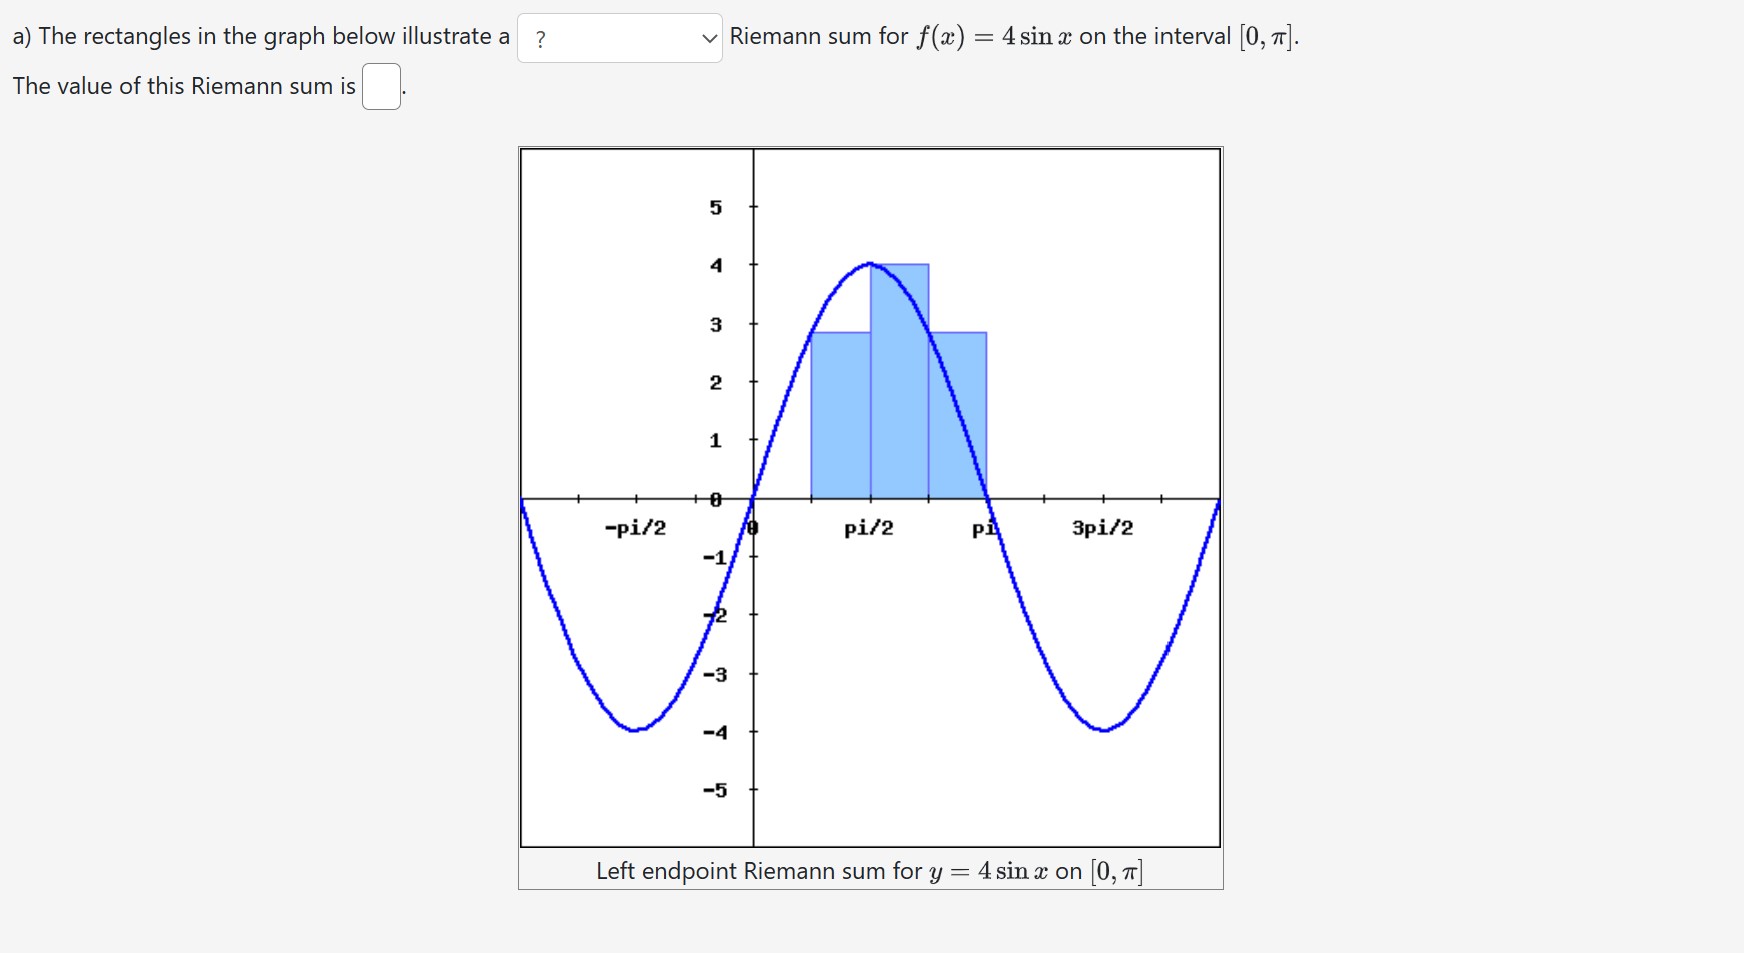
![[3, 7]a) The rectangles in the graph below illustrate a ? Riemann](https://s3.amazonaws.com/si.experts.images/answers/2024/06/666386761e794_5186663867604e44.jpg)
![sum for f(x) = 4 sin x on the interval [0, 7].](https://s3.amazonaws.com/si.experts.images/answers/2024/06/6663867678282_518666386765fdf2.jpg)

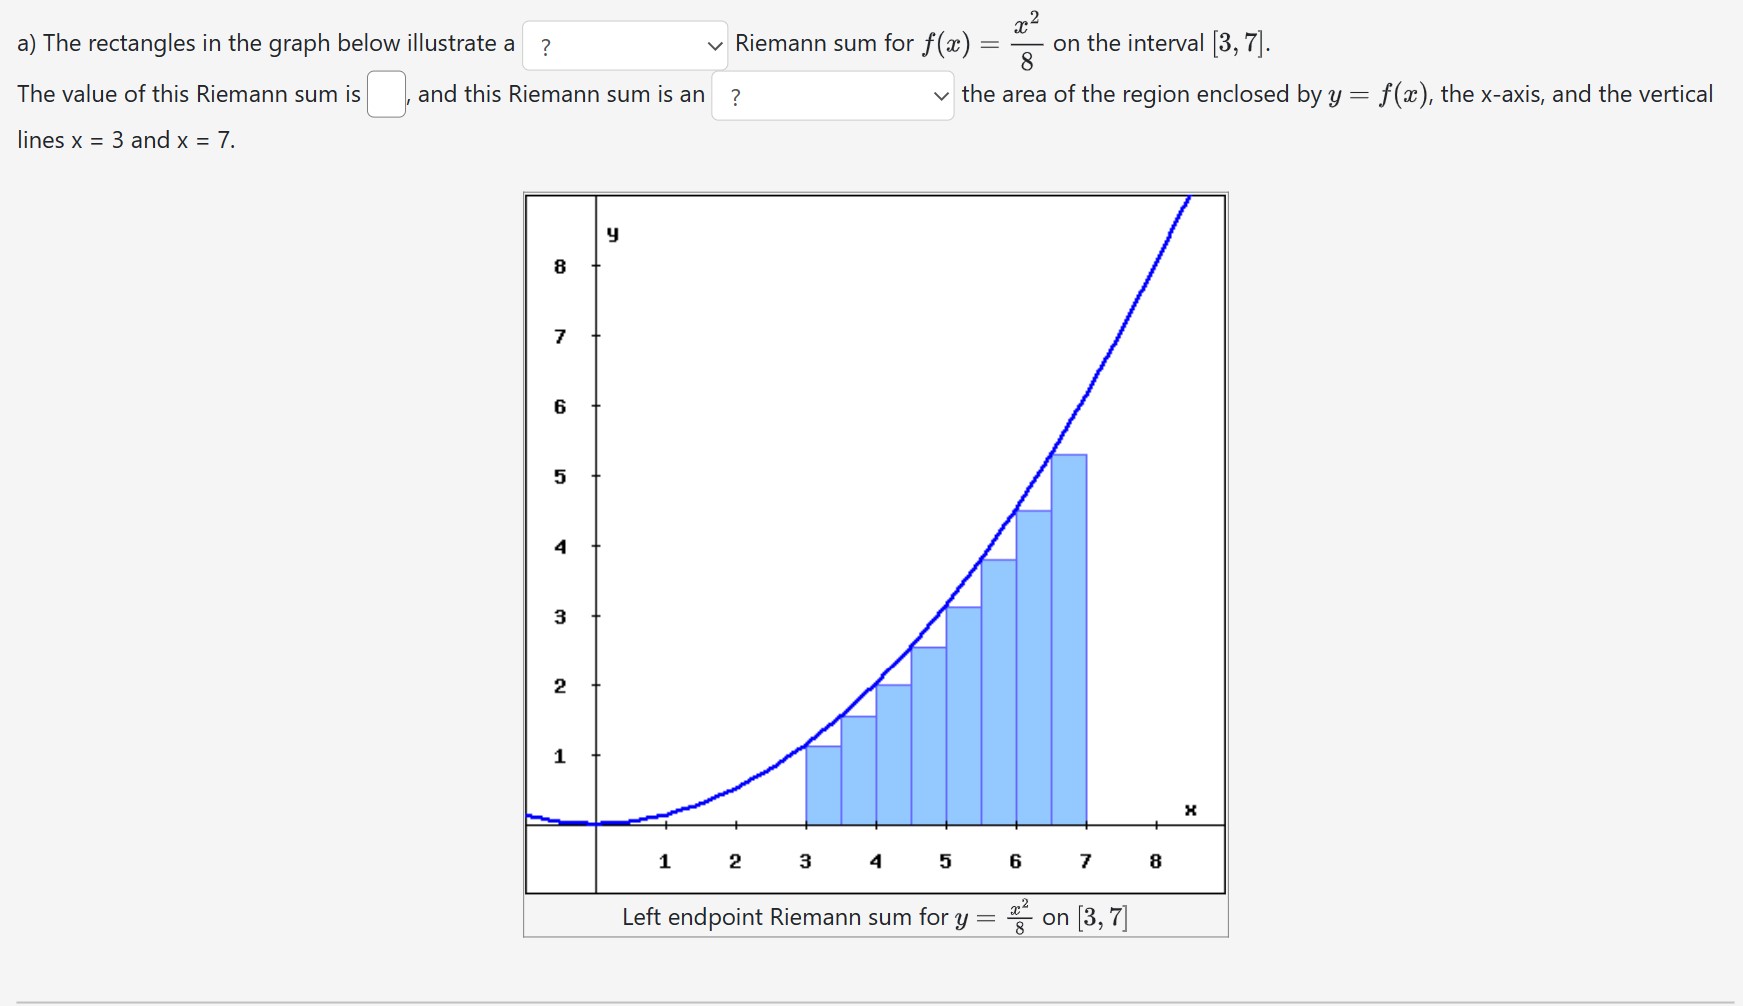
![4 sin x on [0, 7]b) The rectangles in the graph below](https://s3.amazonaws.com/si.experts.images/answers/2024/06/666386776e877_519666386774ecf1.jpg)
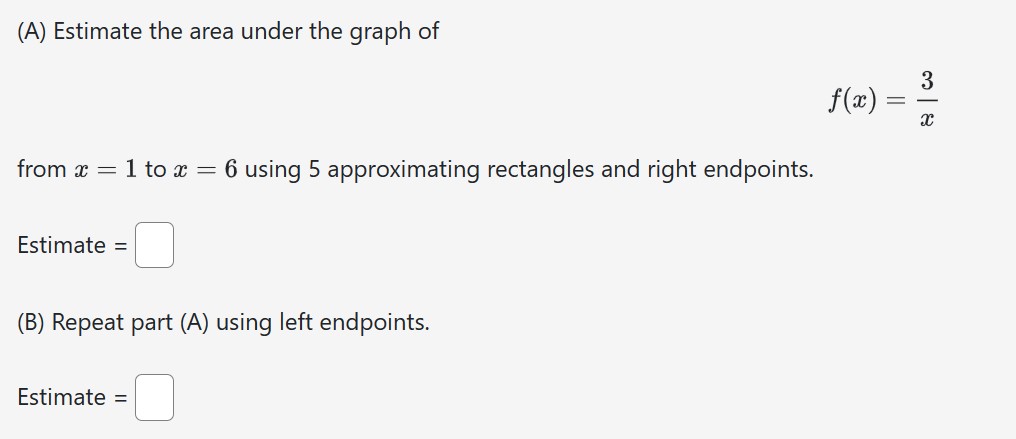
b) The rectangles in the graph below illustrate a ? The value of this Riemann sum is v Riemann sum for f(a) = and this Riemann sum is an 8 on the interval [3, 7]. ? lines x = 3 and x = 7. the area of the region enclosed by y = f(x), the x-axis, and the vertical y 8 7 6 5 4 3 2 1 1 2 3 5 6 7 8 Right endpoint Riemann sum for y = on [3, 7]a) The rectangles in the graph below illustrate a ? Riemann sum for f(x) = 4 sin x on the interval [0, 7]. The value of this Riemann sum is A N 1 -pi/2 pi/2 3pi/2 -1 -3 -4 -5 Left endpoint Riemann sum for y = 4 sin x on [0, 7]b) The rectangles in the graph below illustrate a ? Riemann sum for f(x) = 4 sin x on the interval [0, 7]. The value of this Riemann sum is A -pi/2 pi/2 3pi/2 -1 -3 -4 -5 Right endpoint Riemann sum for y = 4 sin x on [0, 7](A) Estimate the area under the graph of it) = g from a: = l to a: = 6 using 5 approximating rectangles and right endpoints. Estimate = i i (B) Repeat part (A) using left endpoints. Estimate = '7' Estimate the area under the graph of at) : :22 + 3:3 from a: = 5 to a: = 11 using 3 approximating rectangles and left endpoints. Approximation = ii a) The rectangles in the graph below illustrate a ? The value of this Riemann sum is Riemann sum for f(a) = - on the interval [3, 7]. and this Riemann sum is an ? lines x = 3 and x = 7. the area of the region enclosed by y = f(x), the x-axis, and the vertical y 8 6 5 4 3 2 1 H 2 3 5 6 7 8 Left endpoint Riemann sum for y = on [3, 7]
Step by Step Solution
There are 3 Steps involved in it

Get step-by-step solutions from verified subject matter experts