

Question: The five rectangles in the graph below illustrate a midpoint (select a description) Riemann sum for f(x) = 28 on the interval [0, 2]. The

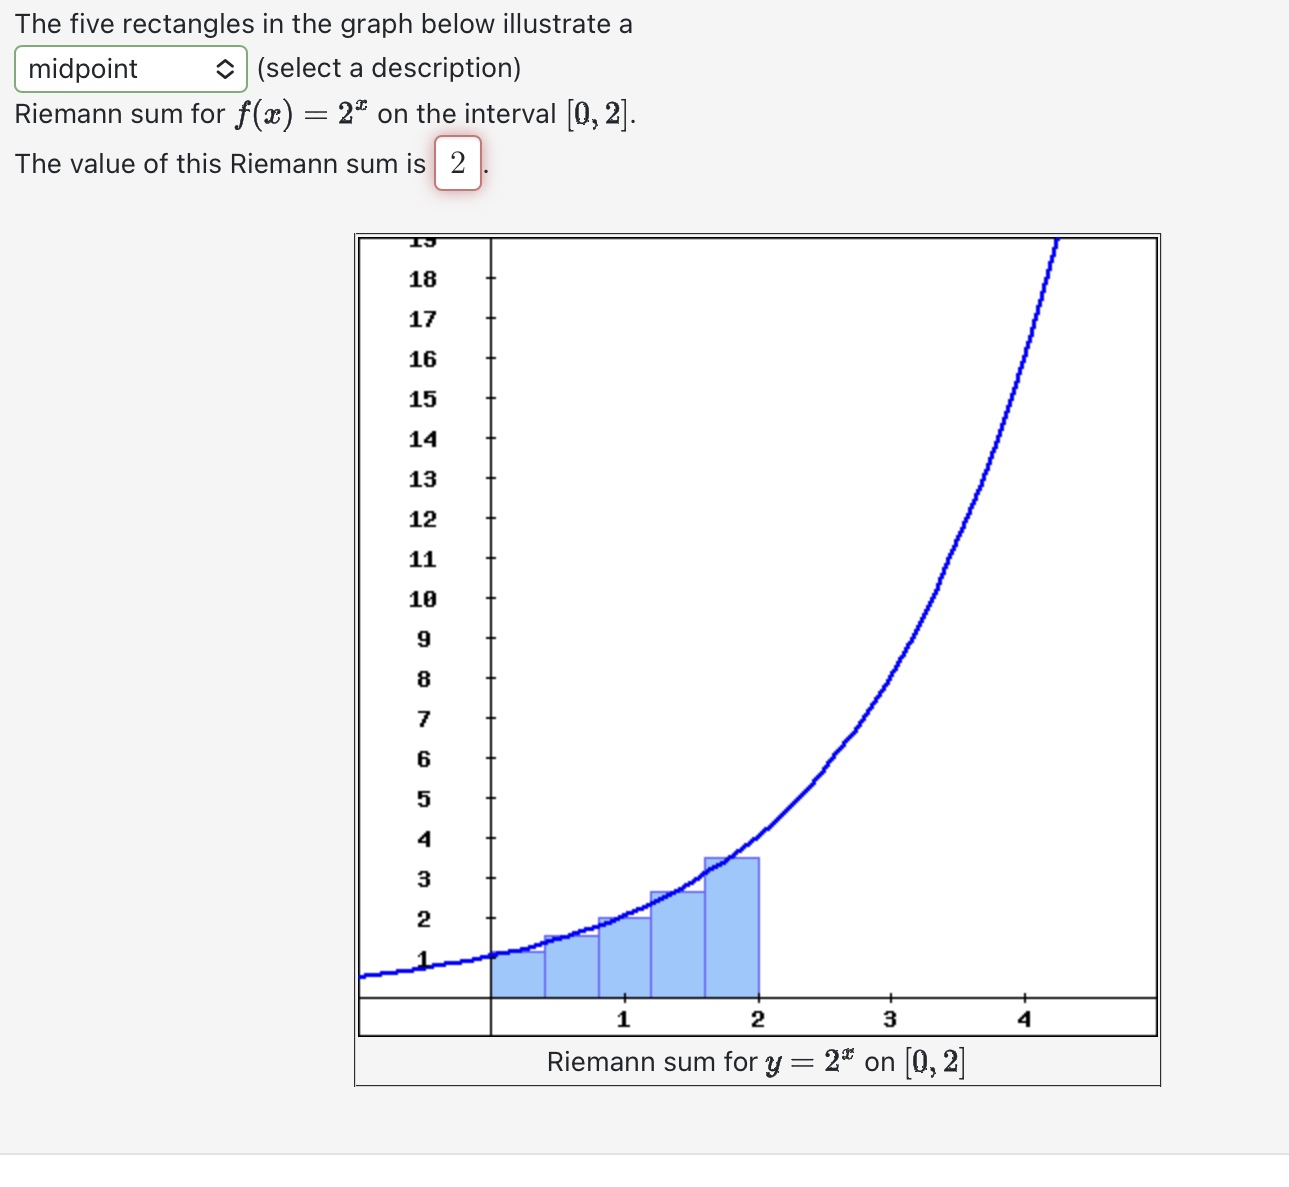
The five rectangles in the graph below illustrate a midpoint (select a description) Riemann sum for f(x) = 28 on the interval [0, 2]. The value of this Riemann sum is 2 IS 18 17 16 15 14 13 12 11 NWAGON OO OO 2 CO . 4 Riemann sum for y = 2* on [0, 2]
Step by Step Solution
There are 3 Steps involved in it
1 Expert Approved Answer
Step: 1 Unlock

Question Has Been Solved by an Expert!
Get step-by-step solutions from verified subject matter experts
Step: 2 Unlock
Step: 3 Unlock