

Question: Based on the Summary Statistics and Opportunity Set Table for XLU and XLB, what are the investment proportions into each one of the funds for
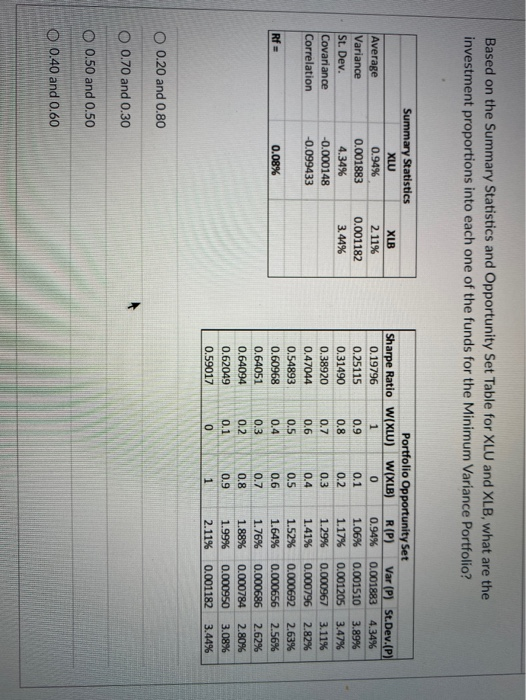
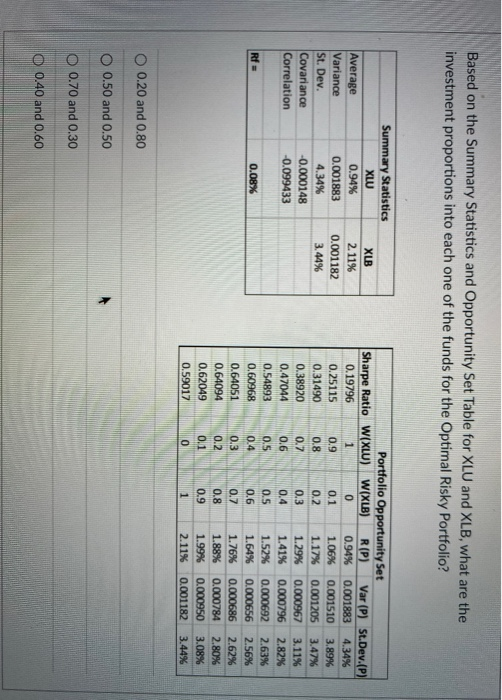
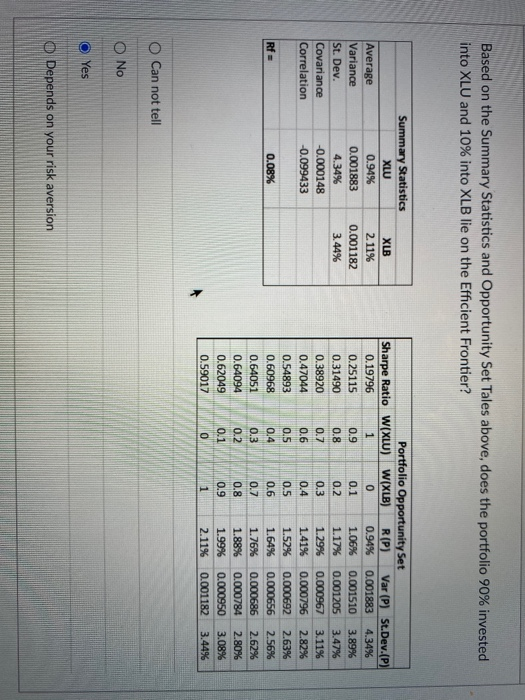
Based on the Summary Statistics and Opportunity Set Table for XLU and XLB, what are the investment proportions into each one of the funds for the Minimum Variance Portfolio? Average Variance St. Dev. Covariance Correlation Summary Statistics XLU 0.94% 0.001883 4.34% -0.000148 -0.099433 XLB 2. 11% 0.001182 3.44% Portfolio Opportunity Set Sharpe Ratio W(XLU) W(XLB) R(P) Var (P) St.Dev.(P) 0.19796 1 0 0.94% 0.001883 4.34% 0.25115 0.9 0.1 1.06% 0.001510 3.89% 0.31490 0.8 0.2 1.17% 0.001205 3.47% 0.38920 0.7 0.3 1.29% 0.000967 3.11% 0.47044 0.6 0.4 1.41% 0.000796 2.82% 0.54893 0.5 0.5 1.52% 0.000692 2.63% 0.60968 0.4 0.6 1.64% 0.000656 2.56% 0.64051 0.3 0.7 1.76% 0.000686 2.62% 0.64094 0.2 0.8 1.88% 0.000784 2.80% 0.62049 0.1 0.9 1.99% 0.000950 3.08% 0.59017 0 1 2.11% 0.001182 3.44% Rf= 0.08% O 0.20 and 0.80 O 0.70 and 0.30 O 0.50 and 0.50 O 0.40 and 0.60 Based on the Summary Statistics and Opportunity Set Table for XLU and XLB, what are the investment proportions into each one of the funds for the Optimal Risky Portfolio? Average Variance St. Dev. Covariance Correlation Summary Statistics XLU 0.94% 0.001883 4.34% -0.000148 -0.099433 XLB 2.11% 0.001182 3.44% Portfolio Opportunity Set Sharpe Ratio W(XLU) W(XLB) R(P) Var (P) St.Dev.(P) 0.19796 1 0 0.94% 0.001883 4.34% 0.25115 0.9 0.1 1.06% 0.001510 3.89% 0.31490 0.8 0.2 1.17% 0.001205 3.47% 0.38920 0.7 0.3 1.29% 0.000967 3.11% 0.47044 0.6 0.4 1.41% 0.000796 2.82% 0.54893 0.5 0.5 1.52% 0.000692 2.63% 0.60968 0.4 0.6 1.64% 0.000656 2.56% 0.64051 0.3 0.7 1.76% 0.000686 2.62% 0.64094 0.2 0.8 1.88% 0.000784 2.80% 0.62049 0.1 0.9 1.99% 0.000950 3.08% 0.59017 0 1 2.11% 0.001182 3.44% Rf= 0.08% O 0.20 and 0.80 O 0.50 and 0.50 O 0.70 and 0.30 O 0.40 and 0.60 Based on the Summary Statistics and Opportunity Set Tales above, does the portfolio 90% invested into XLU and 10% into XLB lie on the Efficient Frontier? Average Variance St. Dev. Covariance Correlation Summary Statistics XLU 0.94% 0.001883 4.34% -0.000148 -0.099433 XLB 2. 11% 0.001182 3.44% Portfolio Opportunity Set Sharpe Ratio W(XLU) W(XLB) R(P) Var (P) St.Dev.(P) 0.19796 1 0 0.94% 0.001883 4.34% 0.25115 0.9 0.1 1.06% 0.001510 3.89% 0.31490 0.8 0.2 1.17% 0.001205 3.47% 0.38920 0.7 0.3 1.29% 0.000967 3.11% 0.47044 0.6 0.4 1.41% 0.000796 2.82% 0.54893 0.5 0.5 1.52% 0.000692 2.63% 0.60968 0.4 0.6 1.64% 0.000656 2.56% 0.64051 0.3 0.7 1.76% 0.000686 2.62% 0.64094 0.2 0.8 1.88% 0.000784 2.80% 0.62049 0.1 0.9 1.99% 0.000950 3.08% 0.59017 o 1 2.11% 0.001182 3.44% Rf 0.08% O Can not tell O No O Yes O Depends on your risk aversion
Step by Step Solution
There are 3 Steps involved in it

Get step-by-step solutions from verified subject matter experts