

Question: Based on the Summary Statistics and Opportunity Set Table for XLU and XLB, what are the investment proportions into each one of the funds for
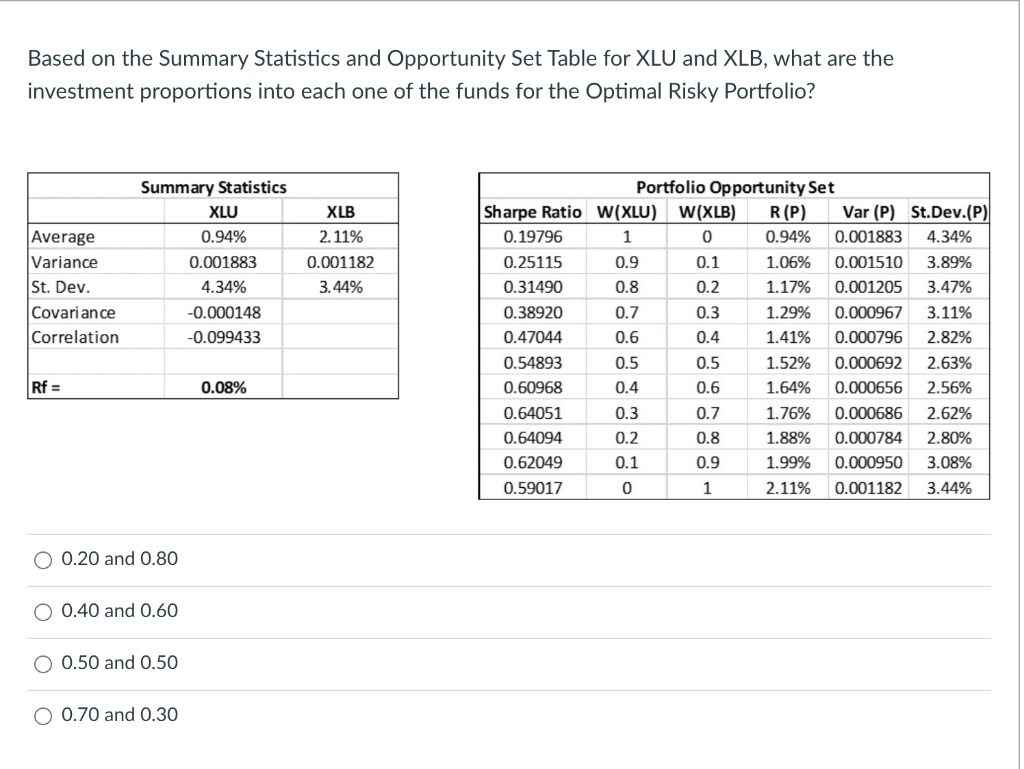
Based on the Summary Statistics and Opportunity Set Table for XLU and XLB, what are the investment proportions into each one of the funds for the Optimal Risky Portfolio? XLB 2. 11% Average Variance St. Dev. Covariance Correlation Summary Statistics XLU 0.94% 0.001883 4.34% -0.000148 -0.099433 0.001182 3.44% Portfolio Opportunity Set Sharpe Ratio W(XLU) W(XLB) R(P) Var (P) St.Dev.(P) 0.19796 1 0 0.94% 0.001883 4.34% 0.25115 0.9 0.1 1.06% 0.001510 3.89% 0.31490 0.8 0.2 1.17% 0.001205 3.47% 0.38920 0.7 0.3 1.29% 0.000967 3.11% 0.47044 0.6 0.4 1.41% 0.000796 2.82% 0.54893 0.5 0.5 1.52% 0.000692 2.63% 0.60968 0.4 0.6 1.64% 0.000656 2.56% 0.64051 0.3 0.7 1.76% 0.000686 2.62% 0.64094 0.2 0.8 1.88% 0.000784 2.80% 0.62049 1.99% 00950 3.08% 0.59017 0 1 2.11% 0.001182 3.44% Rf = 0.08% O 0.20 and 0.80 0.40 and 0.60 O 0.50 and 0.50 0.70 and 0.30
Step by Step Solution
There are 3 Steps involved in it

Get step-by-step solutions from verified subject matter experts