

Question: Consider this normal distribution graph and the information below for the next question: You have analyzed 30 years of historical, annual returns of the SPY
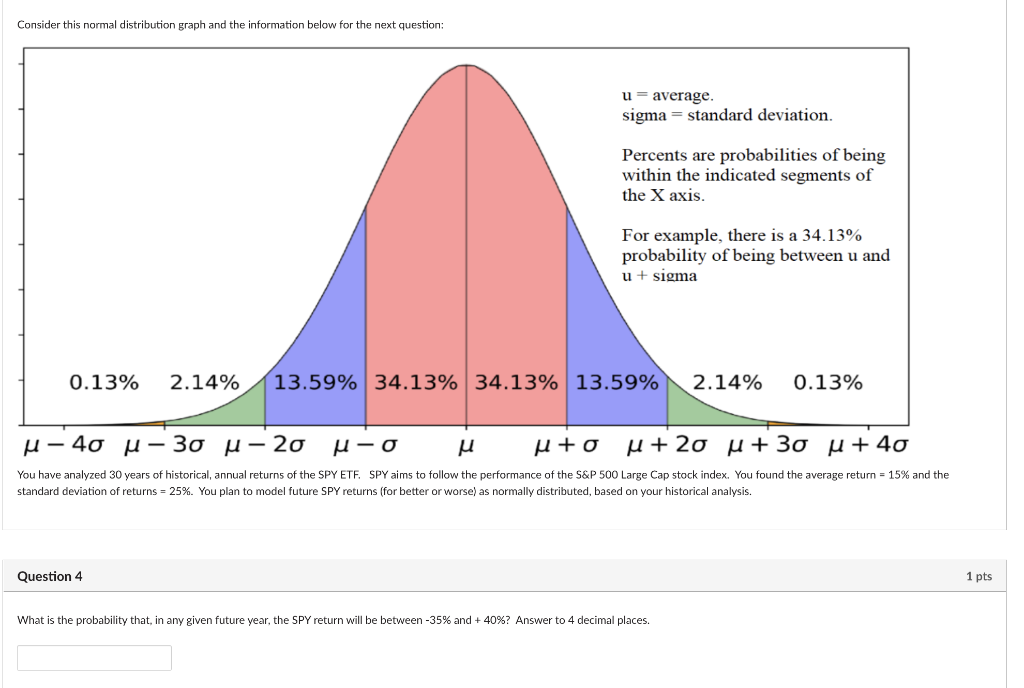
Consider this normal distribution graph and the information below for the next question: You have analyzed 30 years of historical, annual returns of the SPY ETF. SPY aims to follow the performance of the S\&P 500 Large Cap stock index. You found the average return =15% and the standard deviation of returns =25%. You plan to model future SPY returns (for better or worse) as normally distributed, based on your historical analysis. Question 4 What is the probability that, in any given future year, the SPY return will be between 35% and +40% ? Answer to 4 decimal places
Step by Step Solution
There are 3 Steps involved in it
1 Expert Approved Answer
Step: 1 Unlock

Question Has Been Solved by an Expert!
Get step-by-step solutions from verified subject matter experts
Step: 2 Unlock
Step: 3 Unlock