

Question: Consider this normal distribution graph and the information below for the next two questions: un average standard deviation, Sigma Percents are probabilities of being within
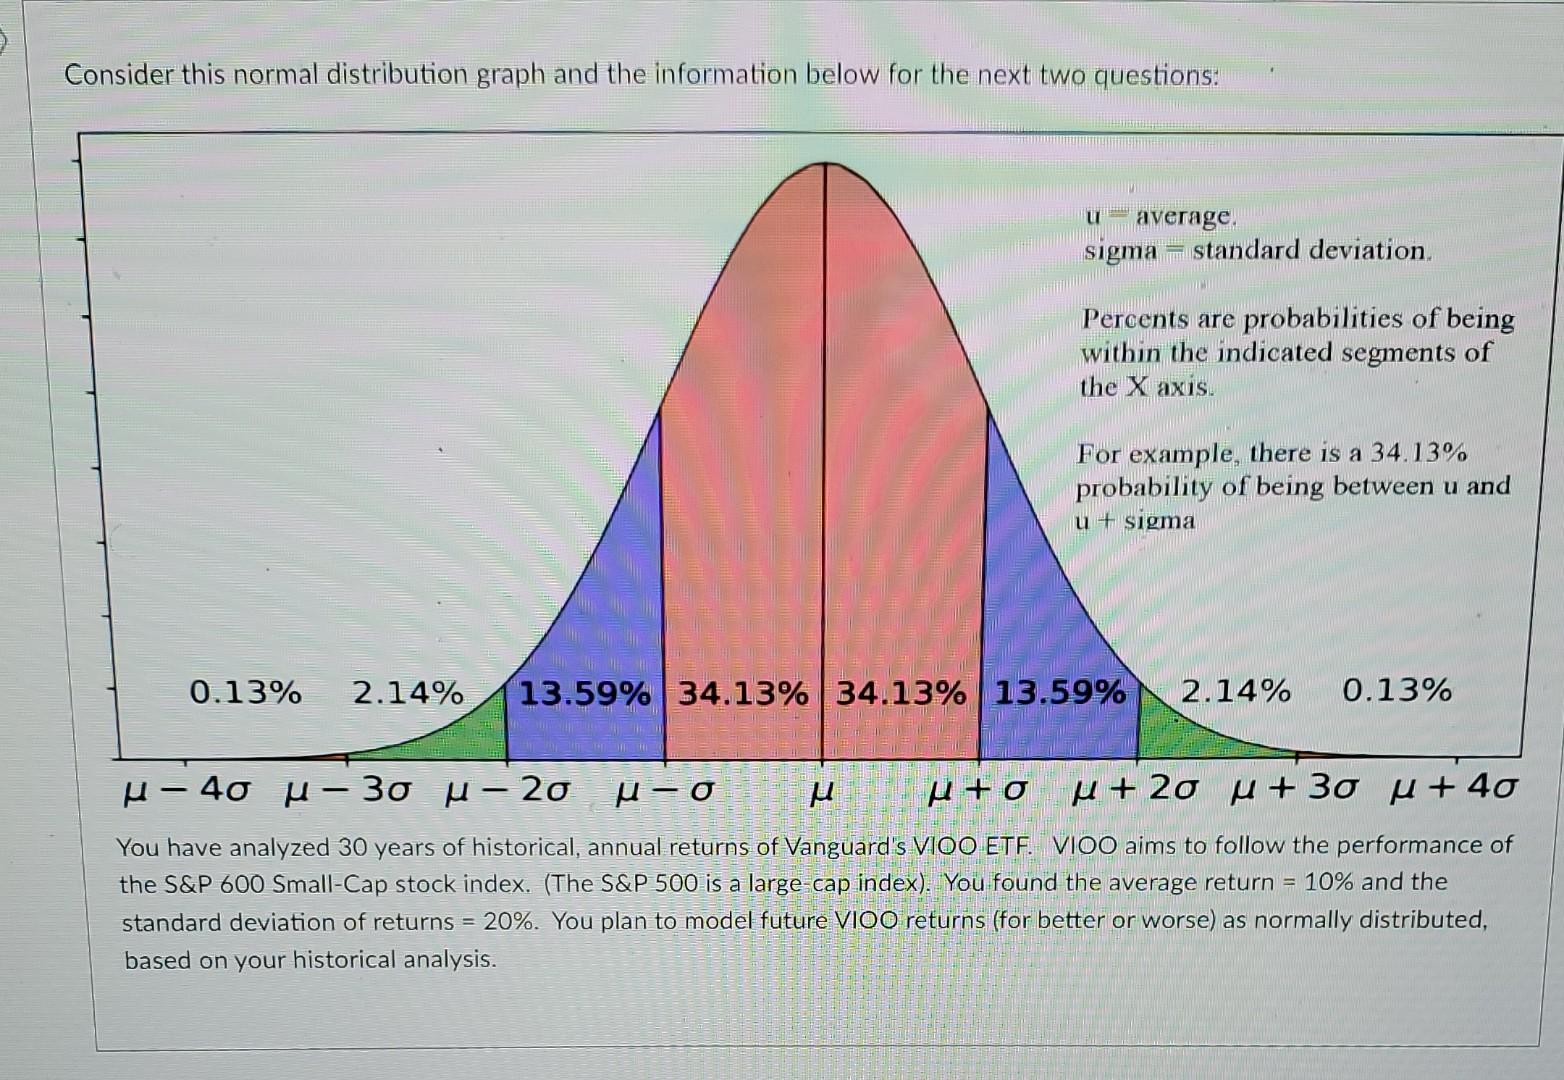
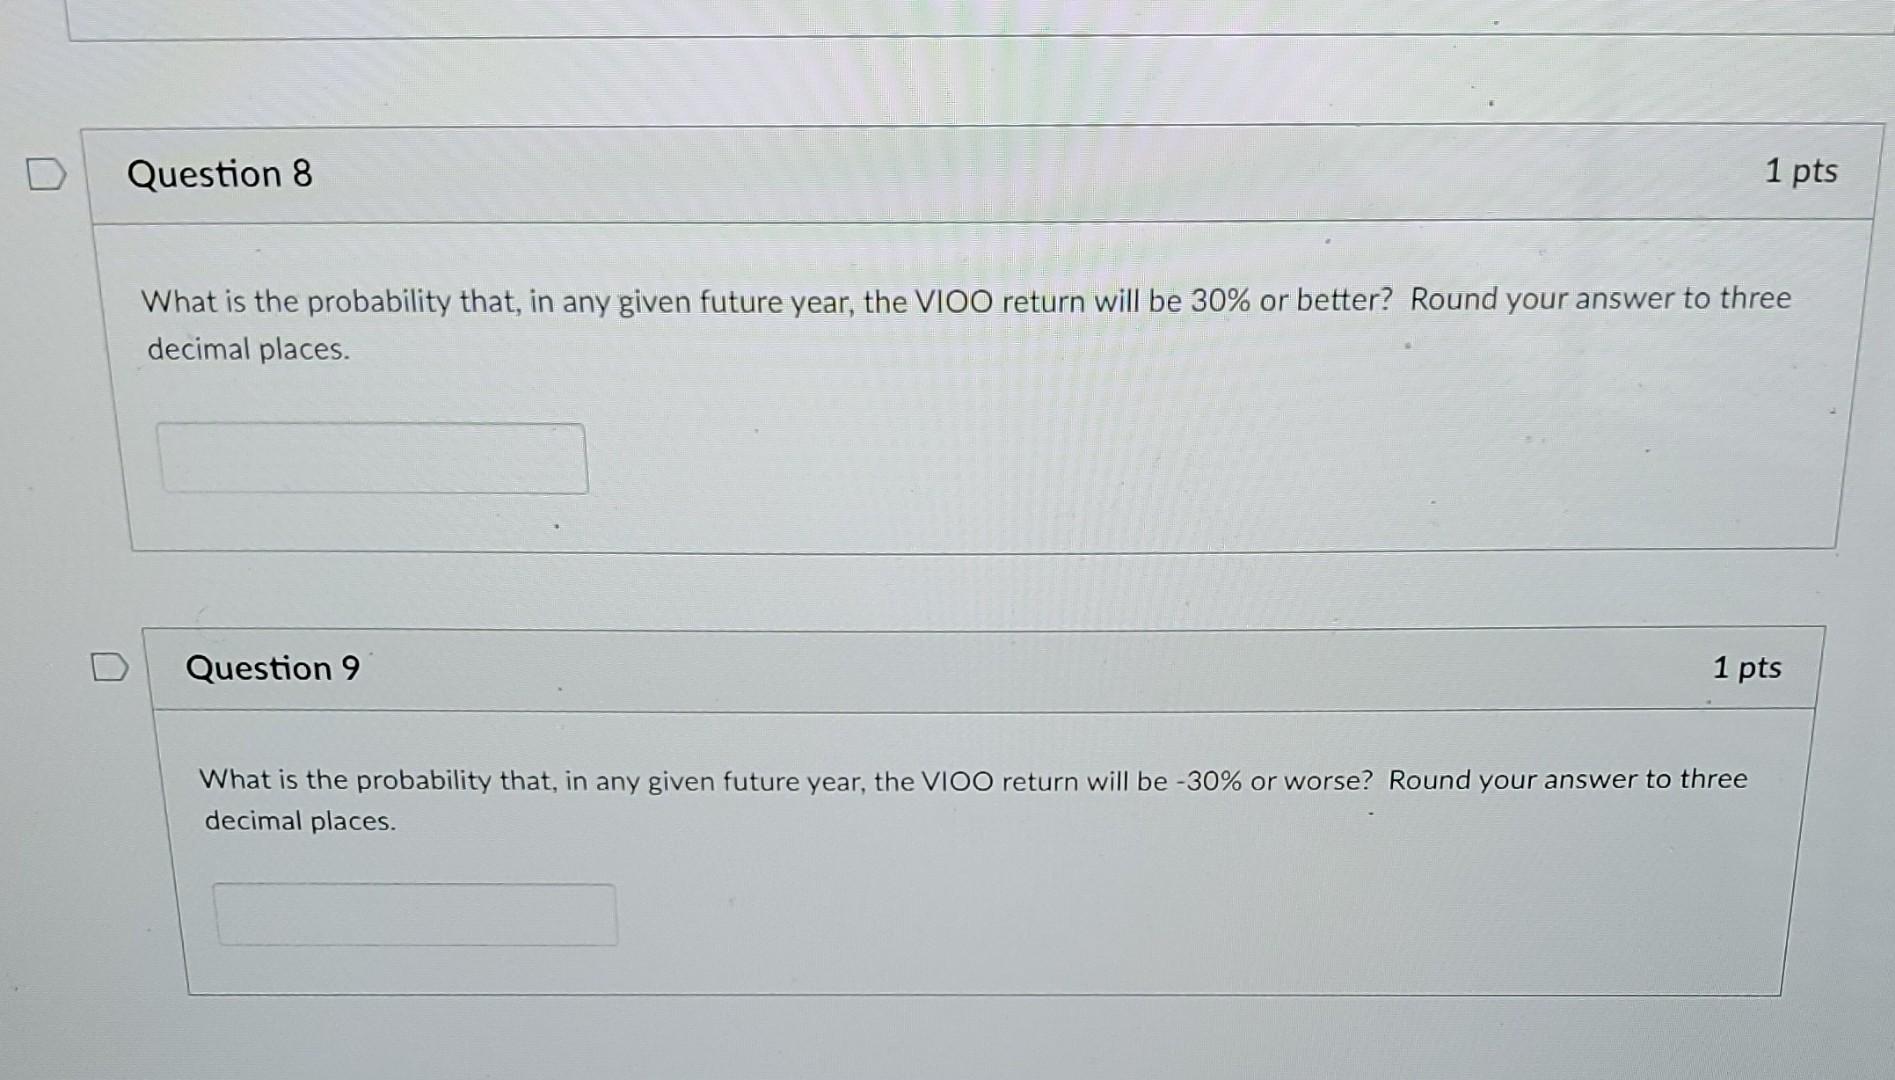
Consider this normal distribution graph and the information below for the next two questions: un average standard deviation, Sigma Percents are probabilities of being within the indicated segments of the X axis. For example, there is a 34.13% probability of being between u and u + sigma 0.13% 2.14% 13.59% 34.13% 34.13% 13.59% 2.14% 0.13% - 4 - 3 - 2 - + + 2 + 3 + 4 You have analyzed 30 years of historical, annual returns of Vanguard's VIOO ETF. VIO0 aims to follow the performance of the S&P 600 Small-Cap stock index. (The S&P 500 is a large cap index). You found the average return = 10% and the standard deviation of returns = 20%. You plan to model future VIOO returns (for better or worse) as normally distributed, based on your historical analysis. Question 8 1 pts What is the probability that, in any given future year, the VIOO return will be 30% or better? Round your answer to three decimal places. Question 9 1 pts What is the probability that, in any given future year, the VIOO return will be -30% or worse? Round your answer to three decimal places
Step by Step Solution
There are 3 Steps involved in it

Get step-by-step solutions from verified subject matter experts