

Question: Construct a scatterplot of the given data. Is there a trend in the data? Are any of the data points outliers? Construct a divided dijference
Construct a scatterplot of the given data. Is there a trend in the data? Are any of the data points outliers? Construct a divided dijference table. Is smoothing with a low-order polynomial appropriate? If so, choose an appropriate polynomial and fit using the least-squares criterion of best fit. Analyze the goodness of fit by examining appropriate indicators and graphing the model, the data points, and the deviations.
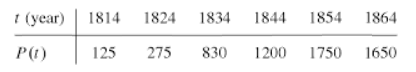
The following data were obtained for the growth of a sheep population introduced into a new environment on the island of Tasmania. (Adapted from J. Davidson, "On the Growth of the Sheep Population in Tasmania," Trans. Roy. Soc. S. Australia 62(1938): 342?346.)
\f
Step by Step Solution
There are 3 Steps involved in it

Get step-by-step solutions from verified subject matter experts