

Question: In Problems 6-12, construct a scatterplot of the given data. Is there a trend in the data? Are any of the data points outliers? Construct
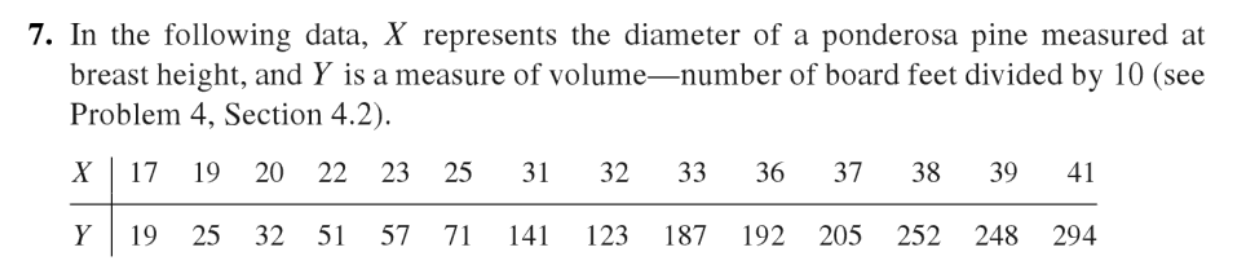
In Problems 6-12, construct a scatterplot of the given data. Is there a trend in the data? Are any of the data points outliers? Construct a divided difference table. Is smoothing with a low-order polynomial appropriate? If so, choose an appropriate polynomial and fit using the least-squares criterion of best fit. Analyze the goodness of fit by examining appropriate indicators and graphing the model, the data points, and the deviations.'7. In the following data, X represents the diameter of a ponderosa pine measured at breast height, and Y is a measure of volumenumber of board feet divided by 10 (see Problem 4, Section 4.2). X 17 19 20 22 23 25 31 32 33 36 37 38 39 41 Y 19 25 32 51 57 71 141 123 187 I92 205 252 243 294
Step by Step Solution
There are 3 Steps involved in it

Get step-by-step solutions from verified subject matter experts