

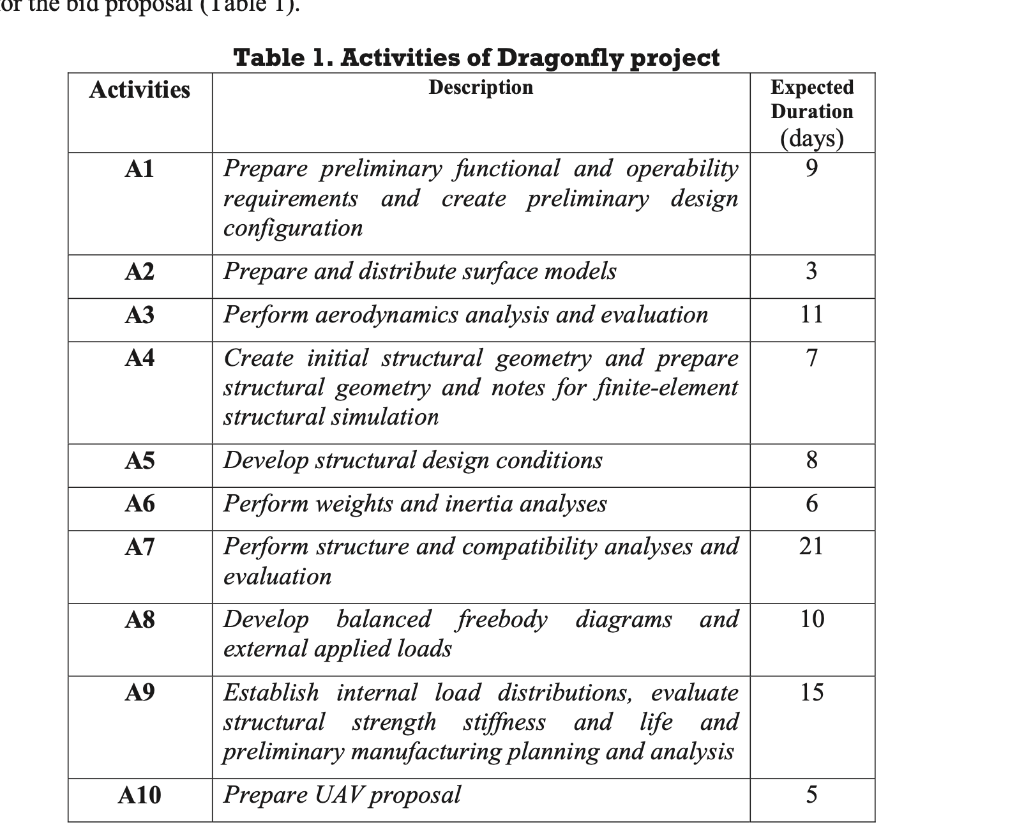
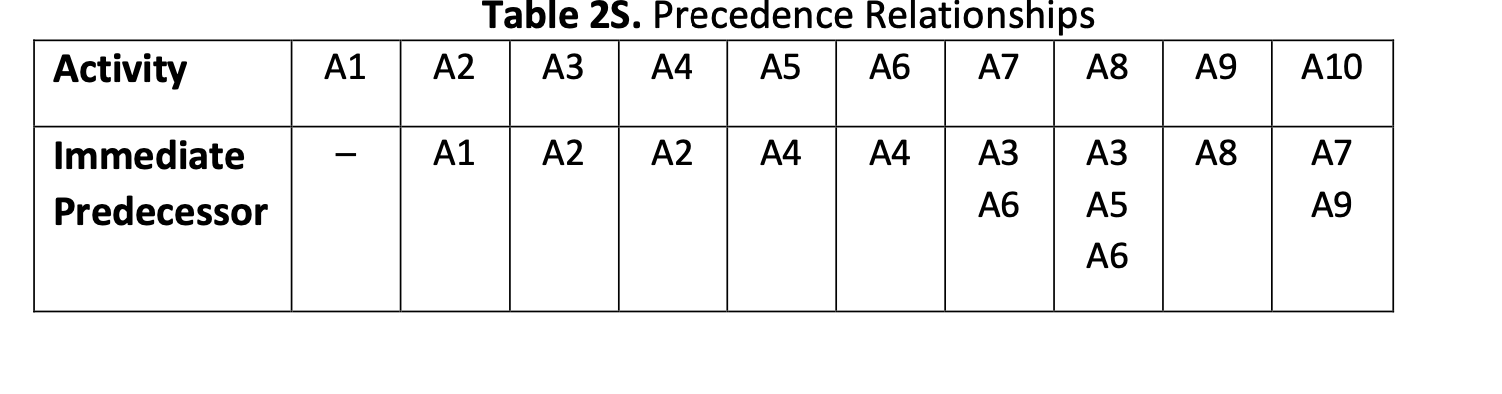
Question: Draw the project network diagram (based on Table 2S). 2) Using the data given in tables 1-3, a. Calculate the expected project duration. b. Report
Draw the project network diagram (based on Table 2S).
2) Using the data given in tables 1-3, a. Calculate the expected project duration. b. Report the ES, EF, LS, LF, and Slack Times in a table like the one on page 3 of
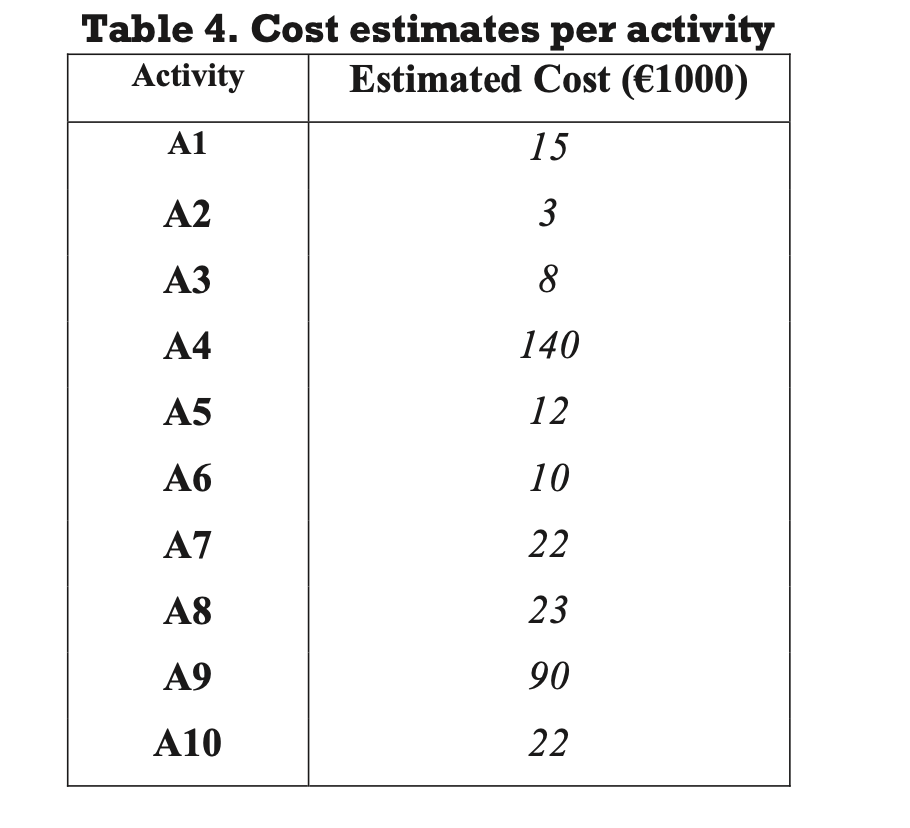
your Project Management note packet. c. Determine the critical path. d. What is the expected cost of the project? Consider Table 4 costs as costs
associated with the expected duration of activities. Hint: As mentioned above, the time values in Table 1 should be considered most likely durations, rather than expected durations.
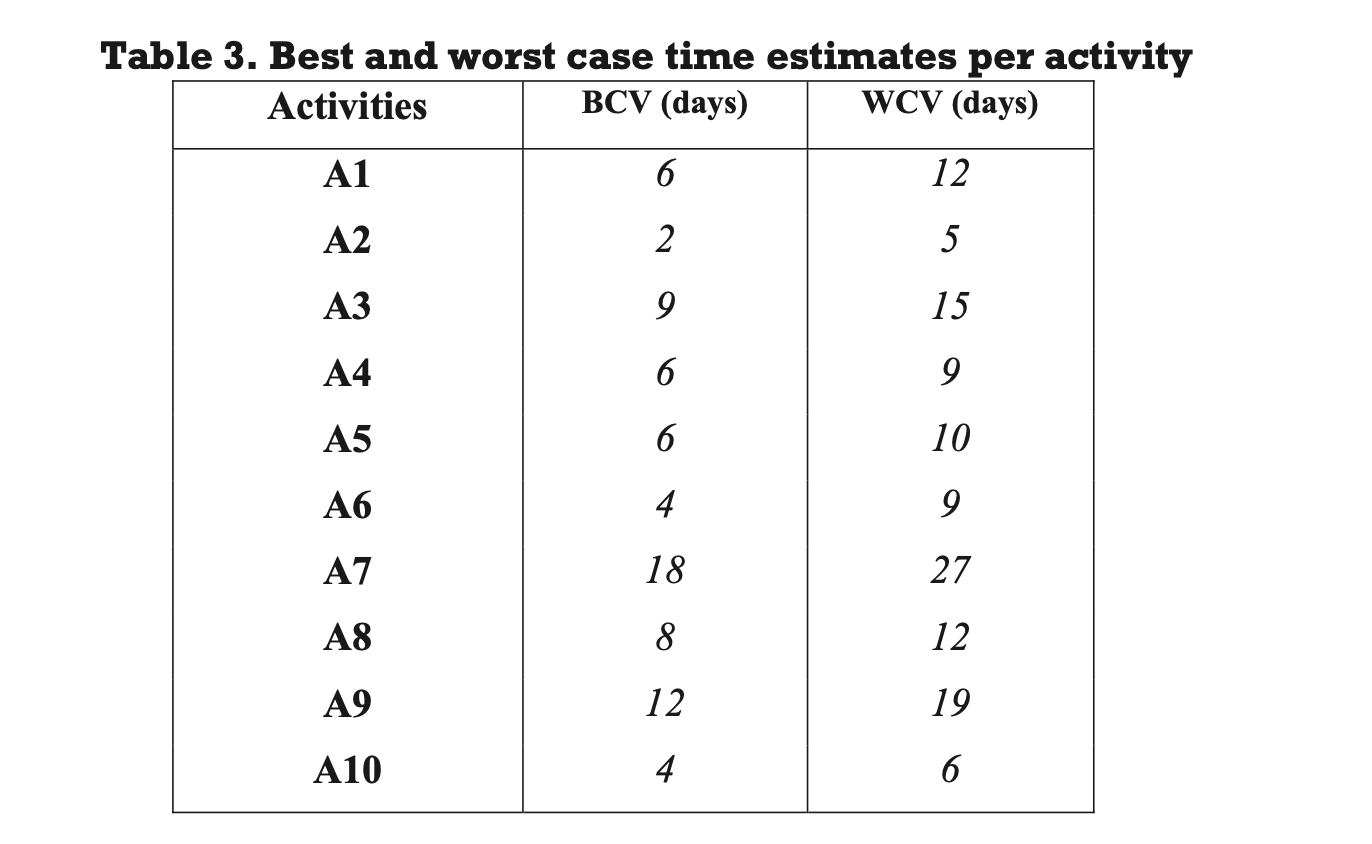
3) Considering the best-case time estimates (BCV) in Table 1,
Make an optimistic (best-case-scenario) estimate of the project duration.
Suppose Bob is looking into whether they can complete the project in 1.5
months (45 days), rather than 2 months. Given your optimistic estimate, how plausible is that? Briefly explain.
Step by Step Solution
There are 3 Steps involved in it

Get step-by-step solutions from verified subject matter experts