

Question: Given is a PERT project network diagram as shown below. Screen Shot 2 0 2 1 - 0 6 - 1 8 at 8 .
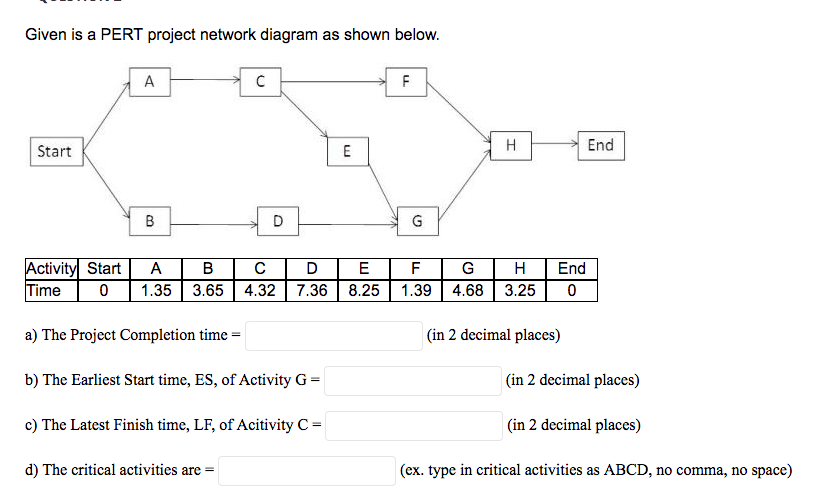
Given is a PERT project network diagram as shown below.
Screen Shot at AMpng
Activity
Start
A
B
C
D
E
F
G
H
End
Time
a The Project Completion time Blank in decimal places b The Earliest Start time, ES of Activity G Blank in decimal places c The Latest Finish time, LF of Acitivity C Blank in decimal places d The critical activities are Blank ex type in critical activities as ABCD, no comma, no space
Step by Step Solution
There are 3 Steps involved in it
1 Expert Approved Answer
Step: 1 Unlock

Question Has Been Solved by an Expert!
Get step-by-step solutions from verified subject matter experts
Step: 2 Unlock
Step: 3 Unlock