

Question: Given the Activity on Arrow Diagram and the data found in the table above, calculate each of the following values: Given the Activity on Arrow
Given the Activity on Arrow Diagram and the data found in the table above, calculate each of the following values:
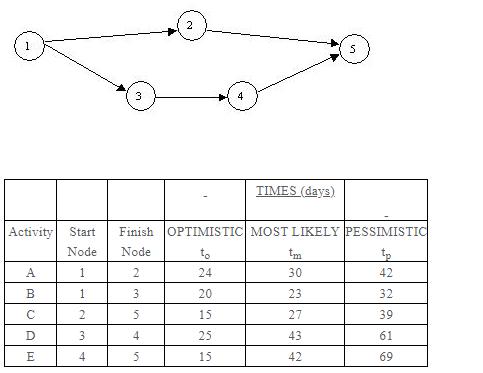
Given the Activity on Arrow Diagram and the data found in the table above, calculate each of the following values:
Activity A………te = 31
Standard Deviation = 3
Activity B………te =
Standard Deviation =
Activity C………te =
Standard Deviation =
Activity D………te =
Standard Deviation =
Activity E………te =
Standard Deviation = 9
Path 1 – 2 – 5
Mean Time =
Standard Deviation =5
Path 1 – 3 – 4 – 5
Mean Time =
Standard Deviation =
2 3 TIMES (daya) Activity Start Finish OPTIMISTIC MOST LIKELY PESSIMISTIC Node Node to tm A 24 30 42 B 3. 20 23 32 2 5 15 27 39 3 4 25 43 61 E 4 15 42 69
Step by Step Solution
3.49 Rating (169 Votes )
There are 3 Steps involved in it
For Individual Activities For ... View full answer

Get step-by-step solutions from verified subject matter experts