

Question: help me please This is directly based on the readings for the week. You may take this as many times as you want, and the
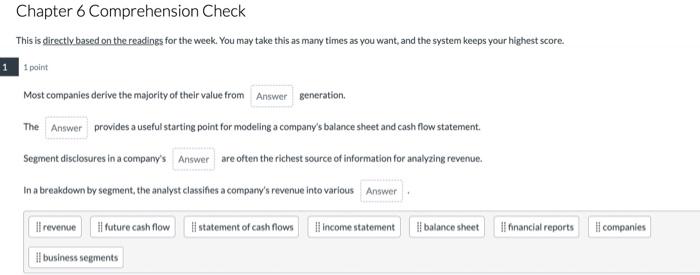
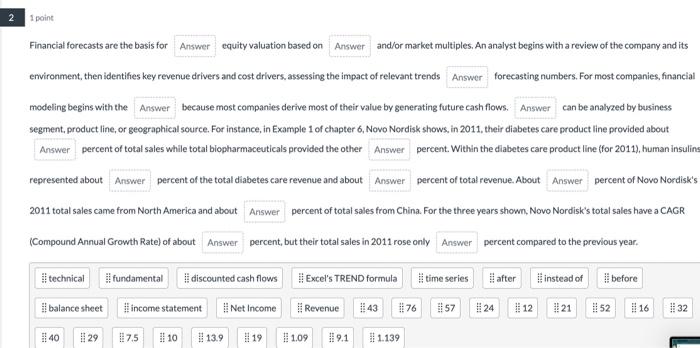
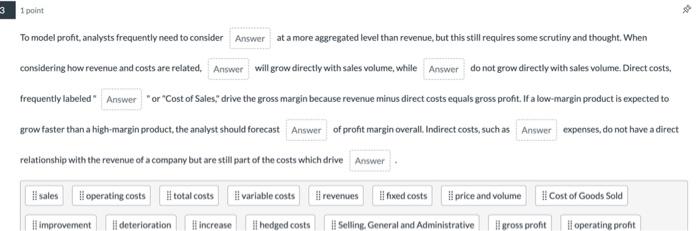

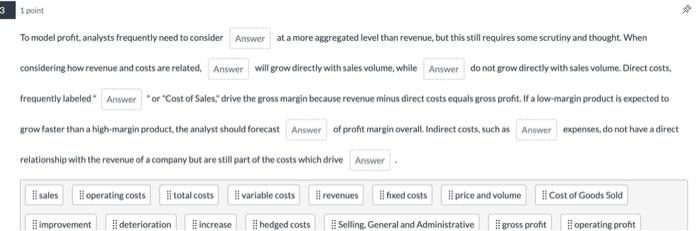
This is directly based on the readings for the week. You may take this as many times as you want, and the system keeps your highest score. 1 point Most companies derive the majority of their value from generation. The provides a useful starting point for modeling a company's balance sheet and cash flow statement. Segment disclosures in a company's are often the richest source of information for analyzing revenue. In a breakdown by segment, the analyst classifies a company's revenue into various Financial forecasts are the basis for equity valuation based on and/or market multiples. An analyst begins with a review of the company and its environment, then identifies key revenue drivers and cost drivers, assessing the impact of relevant trends forecasting numbers. For most companies, financial modeling begins with the ban be analyzed by business segment, product line, or geographical source. For instance, in Example 1 of chapter 6 , Novo Nordisk shows, in 2011 , their diabetes care product line provided about 2011 total sales came from North America and about_ percent of total sales from China. For the three years shown, Novo Nordisk's total sales have a CAGR (Compound Annual Growth Rate) of about_ percent, but their total sales in 2011 rose only percent compared to the previous year. To model profit, analysts frequently need to consider at a more aggregated level than revenue, but this still requires some scrutiny and thought. When considering how revenue and costs are related, will grow directly with sales volume, while do not grow directly with sales volume. Direct costs. frequently labeled" " or "Cost of Sales," drive the gross margin because revenue minus direct costs equals gross profit. If a low-margin product is expected to grow faster than a high-margin product, the analyst should forecast of profit margin overall. Indirect costs, such as expenses, do not have a direct relationship with the revenue of a company but are still part of the costs which drive Financial forecasts are the basis for equity valuation based on and/or market multiples. An analyst begins with a review of the company and its environment, then identifies key revenue drivers and cost drivers, assessing the impact of relevant trends forecasting numbers. For most companies, financial modeling begins with the ban be analyzed by business segment, product line, or geographical source. For instance, in Example 1 of chapter 6 , Novo Nordisk shows, in 2011 , their diabetes care product line provided about 2011 total sales came from North America and about_ percent of total sales from China. For the three years shown, Novo Nordisk's total sales have a CAGR (Compound Annual Growth Rate) of about_ percent, but their total sales in 2011 rose only percent compared to the previous year. To model profit, analysts frequently need to consider at a more aggregated level than revenue, but this still requires some scrutiny and thought. When considering how revenue and costs are related, will grow directly with sales volume, while do not grow directly with sales volume. Direct costs. frequently labeled " "or "Cost of Sales," drive the gross margin because revenue minus direct costs equals gross profit. If a low-margin product is expected to grow faster than a high-margin product, the analyst should forecast of profit margin overall. Indirect costs, such as expenses, do not have a direct relationship with the revenue of a company but are still part of the costs which drive This is directly based on the readings for the week. You may take this as many times as you want, and the system keeps your highest score. 1 point Most companies derive the majority of their value from generation. The provides a useful starting point for modeling a company's balance sheet and cash flow statement. Segment disclosures in a company's are often the richest source of information for analyzing revenue. In a breakdown by segment, the analyst classifies a company's revenue into various Financial forecasts are the basis for equity valuation based on and/or market multiples. An analyst begins with a review of the company and its environment, then identifies key revenue drivers and cost drivers, assessing the impact of relevant trends forecasting numbers. For most companies, financial modeling begins with the ban be analyzed by business segment, product line, or geographical source. For instance, in Example 1 of chapter 6 , Novo Nordisk shows, in 2011 , their diabetes care product line provided about 2011 total sales came from North America and about_ percent of total sales from China. For the three years shown, Novo Nordisk's total sales have a CAGR (Compound Annual Growth Rate) of about_ percent, but their total sales in 2011 rose only percent compared to the previous year. To model profit, analysts frequently need to consider at a more aggregated level than revenue, but this still requires some scrutiny and thought. When considering how revenue and costs are related, will grow directly with sales volume, while do not grow directly with sales volume. Direct costs. frequently labeled" " or "Cost of Sales," drive the gross margin because revenue minus direct costs equals gross profit. If a low-margin product is expected to grow faster than a high-margin product, the analyst should forecast of profit margin overall. Indirect costs, such as expenses, do not have a direct relationship with the revenue of a company but are still part of the costs which drive Financial forecasts are the basis for equity valuation based on and/or market multiples. An analyst begins with a review of the company and its environment, then identifies key revenue drivers and cost drivers, assessing the impact of relevant trends forecasting numbers. For most companies, financial modeling begins with the ban be analyzed by business segment, product line, or geographical source. For instance, in Example 1 of chapter 6 , Novo Nordisk shows, in 2011 , their diabetes care product line provided about 2011 total sales came from North America and about_ percent of total sales from China. For the three years shown, Novo Nordisk's total sales have a CAGR (Compound Annual Growth Rate) of about_ percent, but their total sales in 2011 rose only percent compared to the previous year. To model profit, analysts frequently need to consider at a more aggregated level than revenue, but this still requires some scrutiny and thought. When considering how revenue and costs are related, will grow directly with sales volume, while do not grow directly with sales volume. Direct costs. frequently labeled " "or "Cost of Sales," drive the gross margin because revenue minus direct costs equals gross profit. If a low-margin product is expected to grow faster than a high-margin product, the analyst should forecast of profit margin overall. Indirect costs, such as expenses, do not have a direct relationship with the revenue of a company but are still part of the costs which drive
Step by Step Solution
There are 3 Steps involved in it

Get step-by-step solutions from verified subject matter experts