

Question: Help no images or pdfs please Modeling Real-World Data with Linear Functions Complete the following for each set of data. a. Graph the data on
Help no images or pdfs please
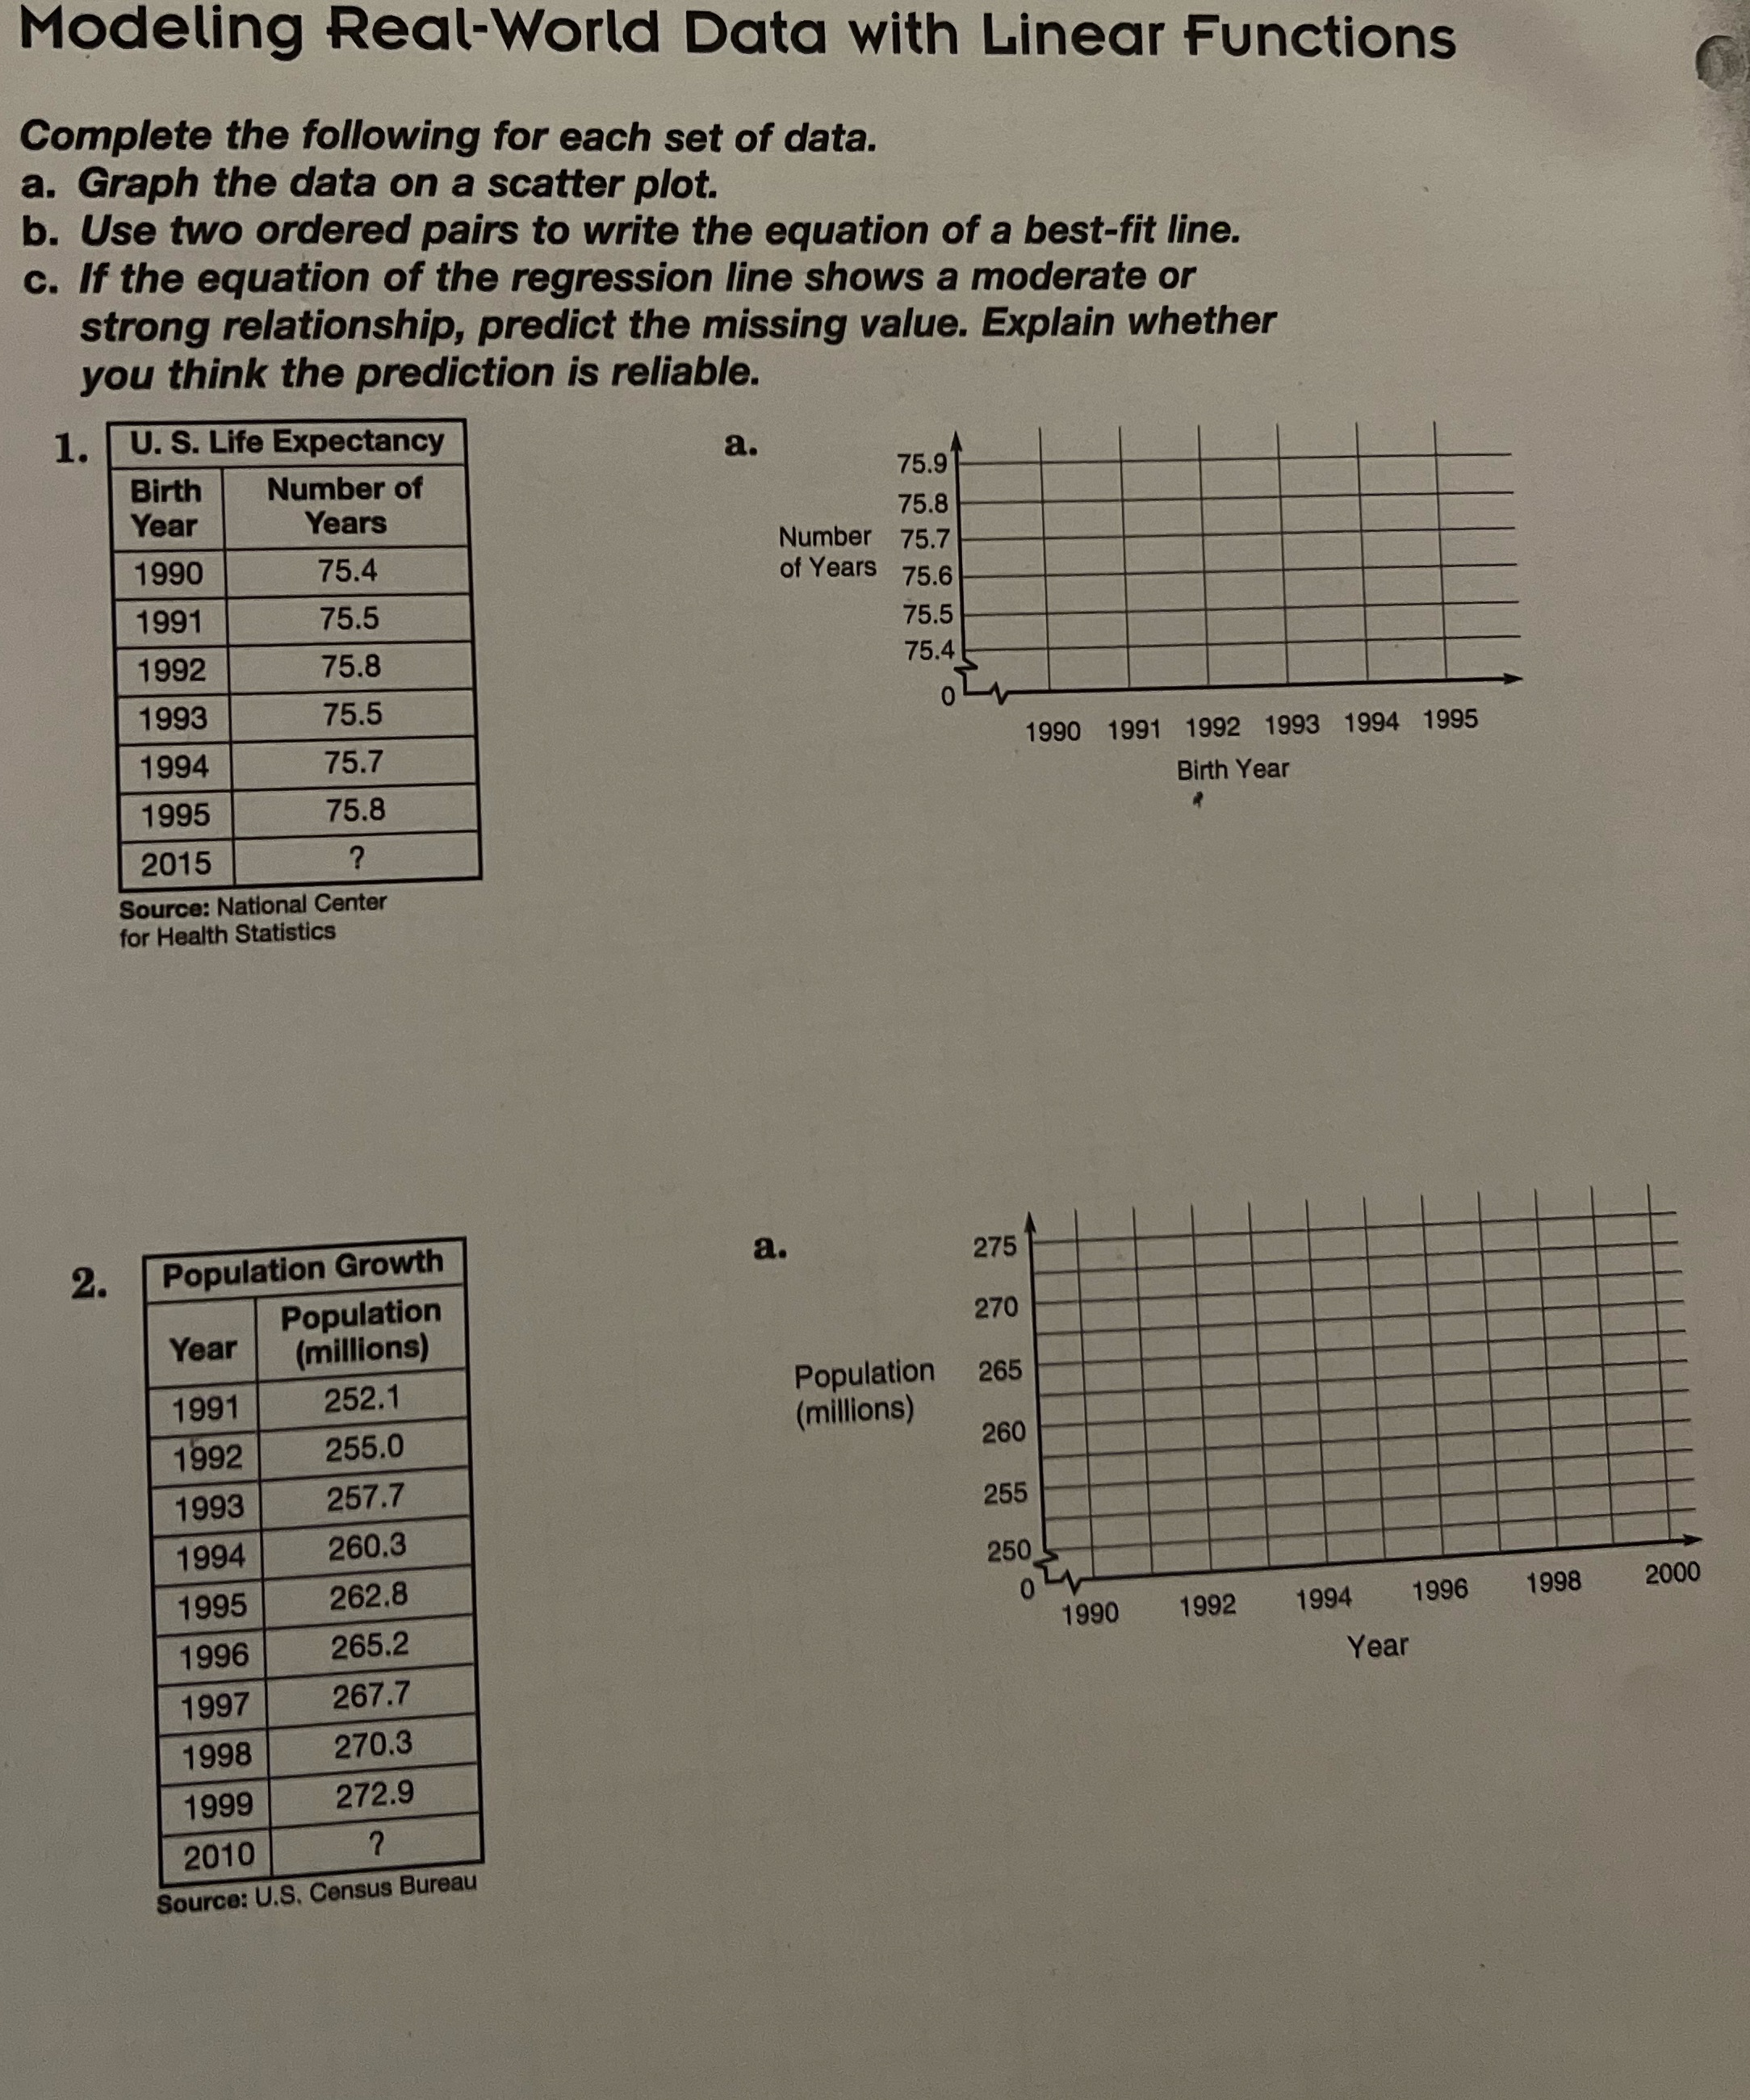
Modeling Real-World Data with Linear Functions Complete the following for each set of data. a. Graph the data on a scatter plot. b. Use two ordered pairs to write the equation of a best-fit line. c. If the equation of the regression line shows a moderate or strong relationship, predict the missing value. Explain whether you think the prediction is reliable. 1. U. S. Life Expectancy a, Birth Number of 75.91 Year Years 75.8 1990 75.4 Number 75.7 of Years 75.6 1991 75.5 75.5 1992 75.8 75.4 1993 75.5 1994 75.7 1990 1991 1992 1993 1994 1995 1995 75.8 Birth Year 2015 Source: National Center for Health Statistics 2. Population Growth a. 275 Population Year 270 (millions) 1991 252.1 Population 265 1992 255.0 (millions) 260 1993 257.7 255 1994 260.3 250 1995 262.8 265.2 1990 1992 1996 1998 2000 1996 1994 1997 267.7 Year 1998 270.3 1999 272.9 2010 ? Source: U.S. Census Bureau
Step by Step Solution
There are 3 Steps involved in it

Get step-by-step solutions from verified subject matter experts