

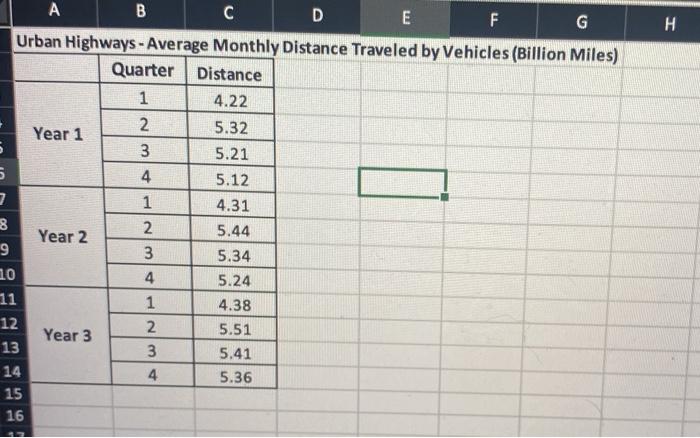
Question: here is the data for the question QUESTION 17 The table in Distance traveled by ych shows the average quarterly distance traveled in billion miles)
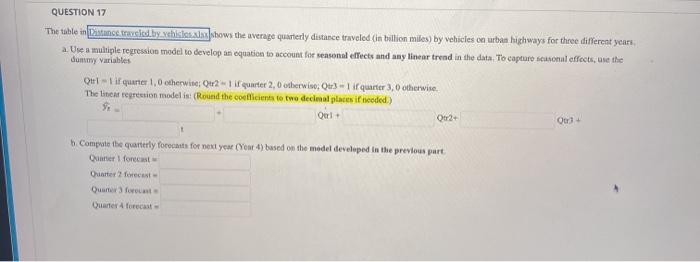
here is the data for the question
Step by Step Solution
There are 3 Steps involved in it
1 Expert Approved Answer
Step: 1 Unlock

Question Has Been Solved by an Expert!
Get step-by-step solutions from verified subject matter experts
Step: 2 Unlock
Step: 3 Unlock