

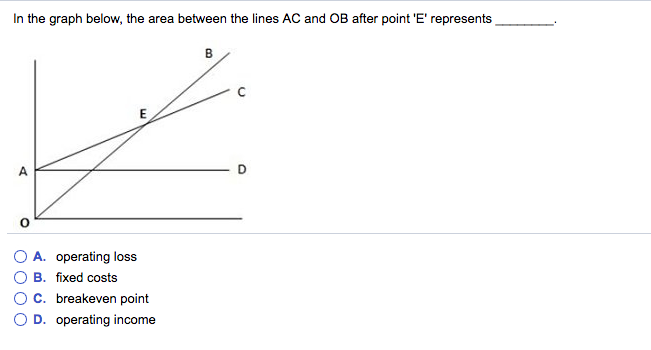
Question: In the graph below, the area between the lines AC and OB after point 'E' represents operating loss fixed costs breakeven point operating income
In the graph below, the area between the lines AC and OB after point 'E' represents operating loss fixed costs breakeven point operating income
Step by Step Solution
There are 3 Steps involved in it
1 Expert Approved Answer
Step: 1 Unlock

Question Has Been Solved by an Expert!
Get step-by-step solutions from verified subject matter experts
Step: 2 Unlock
Step: 3 Unlock