

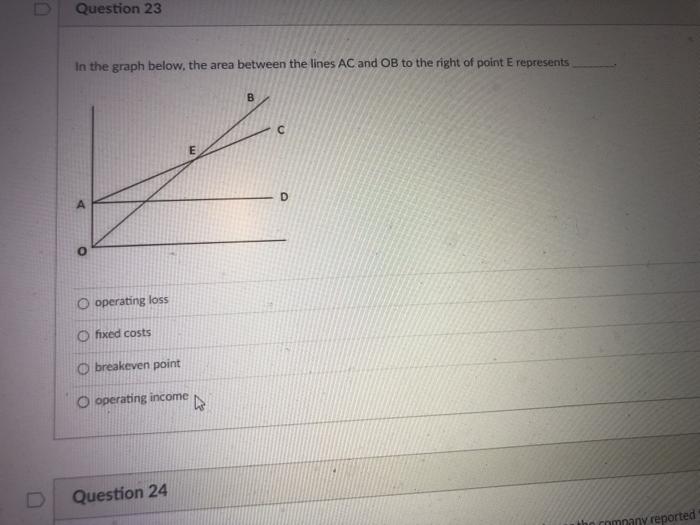
Question: Question 23 In the graph below, the area between the lines AC and OB to the right of point E represents B D P o
Question 23 In the graph below, the area between the lines AC and OB to the right of point E represents B D P o operating loss fixed costs O breakeven point operating income ho Question 24 the company reported
Step by Step Solution
There are 3 Steps involved in it
1 Expert Approved Answer
Step: 1 Unlock

Question Has Been Solved by an Expert!
Get step-by-step solutions from verified subject matter experts
Step: 2 Unlock
Step: 3 Unlock