

Question: please help. If you are unable to answer more than one question please do not reply. this is the best I could get the picture.
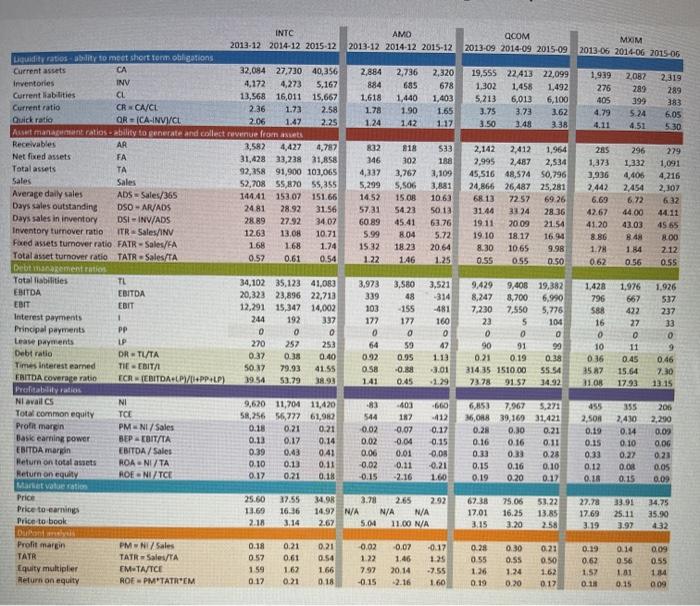
533 1.68 0.61 INTC AMO QCOM 2013-12 2014-12 2015-12 MXM 2013-12 2014-12 2015-12 2013-09 2014-09 2015-09 2013-06 2014-06 2015-06 Liquidity ratios ability to meet short term obligations Current assets CA 32,094 27,730 40,356 2,884 2,736 2,320 19,555 22413 22,099 1,939 2,082 2,319 Inventories INV 4,172 4,273 5.167 884 685 678 1.302 1,458 1,492 276 CL 289 289 Current liabilities 13,568 16,011 15,667 1,618 1,440 1,403 5,213 6,013 6,100 405 399 Current ratio CRCNC 2.36 383 1.23 2.58 1.78 1.90 1.65 3.75 3.73 3.62 4.79 5.24 Quick ratio OR - CAINVI/CL 6.05 2.06 1.47 2.25 1.24 1.42 117 3.50 3.48 3:38 4.11 Amanat ratios ability to generate and collect revenue from iets 4.51 530 Receivables AR 3,582 4,427 832 818 2,142 2,412 1,964 285 296 Net fixed assets FA 279 31,428 33,238 31,858 346 302 188 2,995 2,487 2,534 Total assets 1,373 TA 1,332 1,091 92,358 91,900 103,065 4,337 3,767 3,109 45,516 48,574 50,796 3,936 Sales 4,406 Sales 4,216 52,708 55,870 55,355 5,299 5,506 3,881 24,866 26,487 25,281 2.442 2454 2,307 Average daily sales ADS Sales/365 14441153.07 151.66 14.52 150B 10.63 68.13 2257 6926 6.69 Days sales outstanding 6.72 632 OSO - AR/ADS 2481 28.92 31.56 57.31 54.23 50.13 31.44 33 24 28.36 42.67 44.00 Days sales in inventory 44.11 DSI - INV/ADS 28.89 27.92 34.07 6089 45.41 63.76 1911 2009 21.54 41.20 43.03 45 65 Inw ory turnover ratio ITR Sales/INV 12.63 13.08 10.71 5.99 8.04 5.72 19.10 18.17 16.94 8.86 848 8.00 Faxed assets turnover ratio FATR - Sales/FA 1.68 1.74 15 32 18.23 20.64 8.30 10,65 9.98 1.7 1.84 212 Total asset turnover ratio TATR - Sales/TA 0.57 0.54 1.22 146 1.25 0.55 0.55 0:50 0.62 0.56 Debt management ratios 0.55 Total liabilities TL 34,102 35,123 41,083 3,973 3.580 3,521 EBITDA 9.429 9,406 19,382 1,428 1,976 1.926 EBITDA 20,323 23,896 22,713 339 48 -314 8,247 8,700 6,990 796 EBIT 667 537 EBIT 12.291 15,347 14,002 103 -155 -481 7,230 7.550 5,776 588 422 237 Interest payments 1 244 192 337 177 177 160 23 5 104 16 33 Principal payments 27 PP 0 0 0 0 o 0 0 0 0 0 0 Lease payments UP 270 257 253 64 59 90 91 99 10 11 Debt ratio DR-TUTA 0.37 0.38 0.40 0.92 0.95 1.13 0.21 0.19 0.38 036 0.45 Times Interest earned 0.46 TIE EBITA 5017 79.93 41.55 0.58 -0.88 -3.01 314 35 1510.00 55.54 3587 15.64 FAITDA coverage ratio ICR (EBITDA+LP1/01+PP+LP) 7.30 39 54 53.79 1.41 0.45 73.78 91.57 34.92 31.03 1793 13.15 Profitability ratios NI avail CS NI 9,620 11,704 11,420 -83 403 -600 7,967 5.271 355 205 Total common equity TCE 50,256 6,777 61,982 544 187 412 16,088 39,16031,421 2,508 2,410 2,200 PMNI/Sales 0.18 0.21 0.21 -0.02 -0.07 0.17 0.28 0.30 0.21 0.19 0.34 0.09 Baskearning power BEPTBIT/TA 0.13 0.17 0.14 0.02 -0.04 0.15 0.16 0.16 011 0.15 0.10 0.06 EBITDA margin EBITDA/ Sales 0.39 0.43 0.41 0.00 0.01 -0.08 0.33 0.33 0.28 0.33 0.22 0.23 Return on total assets ROANI/TA 0.10 0.13 0.11 0.02 0.11 -0.21 0.15 0.16 0.10 0.12 0.08 0.05 Return on equity ROEN/TCE 0.17 0.21 0.18 -0.15 -2.16 1.60 0.19 0.20 0.12 0.18 0.15 0.09 Maret value ration Price 25.60 37.55 34.98 3.78 2.65 2.92 67.38 75.06 53.22 27.78 33.91 34.75 Price to earnings 13.69 16.36 14.97 N/A N/A N/A 17.01 16.25 13.85 17.69 25.11 35.90 Price to book 2.18 3.14 2.67 5.044 11.00 N/A 315 3.20 2.58 3.19 3.97 432 Durant el Profit margin PMNI/Sales 0.18 0.21 0.21 0,02 -0.07 -0.17 0.28 0.30 0.19 0.14 0.09 TATR TATR Sales/TA 0.57 0.61 0.54 122 1.46 1.25 0.55 0.55 0.50 0.62 0.56 0.55 Equity multiplier EM T/TCT 1.59 1.62 1.66 7.92 2014 -7.55 1.26 1.24 1.62 1.52 1.81 184 Return on equity ROEPM'TATR'EM 0.17 0.21 0.18 -0.15 -2.16 1.60 0.19 0.20 017 0.18 0.15 009 Profit margin 0.21
Step by Step Solution
There are 3 Steps involved in it

Get step-by-step solutions from verified subject matter experts