

Question: please help. If you are unable to answer more than one question please do not reply. this is the best I could get the picture.
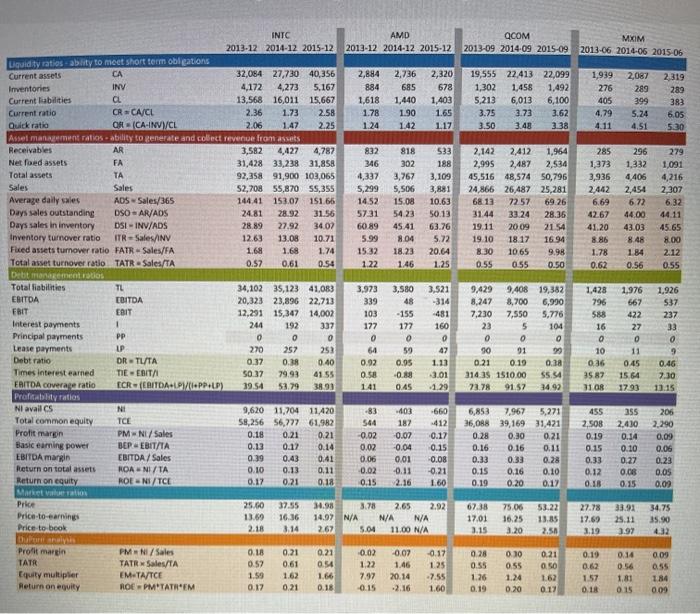
INTC AMD QCOM MXIM 2013-12 2014-12 2015-12 2013-12 2014-12 2015-12 2013-09 2014-09 2015-09 2013-06 2014-06 2015-06 Liquidity ratios abity to meet short term obligations Current assets CA 32,084 27,730 40,356 2,884 2,736 2,320 19,555 22.413 22,099 1,939 2,087 2.319 Inventories INV 4.172 4,273 5.167 884 685 678 1,302 1,456 1,492 276 289 289 Current liabilities CL 13,568 16,011 15,667 1,618 1,440 1,403 5,213 6,013 6,100 405 399 383 Current ratio CR-CA/CL 2.36 1.73 2.58 1.78 1.90 1.65 3.75 3.73 3.62 4,79 5.24 6.05 Quick ratio OR (CA-INV)/CL 2.06 1.47 2.25 1.24 1.42 117 3.50 3.48 3.38 4.11 4.51 530 Asset management ratios ability to generate and collect revenue from assets Receivables AR 3,582 4,427 4,787 832 818 533 2,142 2,412 1,964 285 296 279 Net foed assets EA 31,428 33,238 31,858 346 302 188 2,995 2,487 2.534 1,373 1,332 1,091 Total assets TA 92,358 91,900 103,065 4,337 3,767 3,109 45,516 48,574 50,796 3,936 4.406 4,216 Sales Sales 52,708 55,870 55,355 5,299 5,506 24,866 26,487 25,281 2.442 2,454 2,307 Average daily sales ADS Sales/365 144.41 153.07 151.66 14.52 15.08 10.63 6813 7257 69.26 6.69 6.72 6.32 Days sales outstanding OSOAR/ADS 24.81 28.92 31.56 5731 5423 50.13 31.44 33.24 28.36 42.67 44.00 44.11 Days sales in inventory DSI - INV/ADS 28.89 27.92 3407 60.89 45.41 63.76 19.11 20.09 2144 41.20 43.03 45 65 Inventory turnover ratio ITR Sales/INV 12.63 13.08 10.71 5.99 8.04 5.72 19.10 18.17 16 94 8.86 8.48 800 Fued assets turnover ratio FATR Sales/FA 1.68 1.68 1.74 15:32 18.23 20.64 8.30 1065 9.98 1.78 1.84 2.12 Total asset turnover ratio TATR - Sales/TA 0.57 0.61 0.54 1.22 1.46 1.25 0.55 0.55 0.50 0.62 0.56 055 Debit mandementos Total liabilities TL 34,102 35,123 41,083 3,973 3.580 3,521 9,429 9.408 19,382 1,428 1.976 1.926 EBITDA EBITDA 20,323 23,896 22,713 339 48 -314 8,247 8,700 6.990 667 FRIT EDIT 12,291 15.347 14,002 103 - 155 -481 7,230 7,550 5.776 588 422 237 Interest payments 1 244 192 307 177 172 160 23 104 16 27 33 Principal payments PP 0 0 0 0 0 0 0 0 0 Lease payments UP 270 257 253 64 59 47 90 91 99 10 11 9 Debt ratio DRTL/TA 0.37 0.38 0.40 0.92 0.95 1.11 0.21 0.19 0.38 0.36 0.45 0.46 Times Interest earned TIE-ERITA 50.37 79.93 4155 0.58 -0.88 3.01 314 35 1510.00 55.54 35.87 15.64 7.30 EBITDA coverage ratio ECREBITDA-LPPP+LP) 39.54 53.79 38.93 141 045 -1.29 73.78 91.57 34 92 31.08 1793 11.15 Profitability ratios Ni avail CS NI 9,620 11,704 11/20 -83 103 -660 6,853 7.967 5,271 455 355 206 Total common equity TCE 58.256 56,777 61.982 544 182 -412 36,088 39,16931,421 2.430 2.290 PMNI/Sales 0.18 0.21 0.21 0.02 -0.07 0.17 0.28 0.30 0.21 0.19 0.14 0.09 Basic earning power BEREBIT/TA 0.13 0.12 0.14 0.02 -0.04 0.16 0.11 0.15 0.10 0.06 EBITDA margin EBITDA/ Sales 0.39 0.43 0.41 0.06 0.01 0.08 0.33 0.33 0.28 0.33 0.27 0.23 Return on total assets ROANI/TA 0.10 0.13 0.11 0.02 -0.11 -0.21 0.15 0.16 0.10 0.12 0.05 0.05 Return on equity ROEN/TCE 0.17 0.21 0.18 0.15 2.16 1.60 0.19 0.20 0.17 0.18 0.15 0.00 796 537 . 2.508 Profit margin 0.15 0.16 25.GO 13.69 2.18 37.55 16.36 3.14 34.98 3.78 2.65 2.92 14.97 N/A N/A N/A 2.67 5.04 11.00 N/A 67.38 17.01 3.15 75.06 16.25 3.20 53.22 13.85 2.50 27.78 17.69 3.19 33.91 25.11 3.97 34.75 35.90 4.32 Price Price to earnings Price-to-book Duranalyse Profit margin TATR Equity multiplier Return on equity PMNI / Sales TATRSales/TA EM TA/TCE ROEPM'TATEM 0.18 0.57 1.59 0.17 0.21 0.61 1.62 0.21 0.21 0.54 1.66 0.18 0.02 1 22 7.97 -0.15 -0.07 1.46 20.14 -0.17 1.25 -7.55 1.60 0.28 0.55 1.26 0.19 0.10 0.55 1.24 0.20 0.21 050 162 0.17 0.19 0.62 1.57 0.18 0.14 0.56 1.81 015 0.09 0.55 184 0.09
Step by Step Solution
There are 3 Steps involved in it

Get step-by-step solutions from verified subject matter experts