Question: please help. If you are unable to answer more than one question please do not reply. this is the best I could get the picture.
please help. If you are unable to answer more than one question please do not reply. this is the best I could get the picture. will thumbs up.
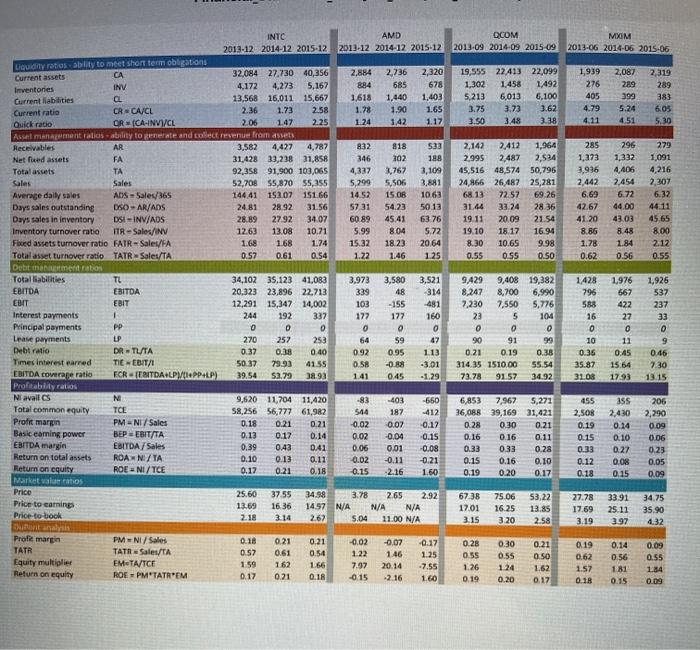
DCOM 2013-09 2014-09 2015-09 MXIM 2013-06 2014-06 2015-06 19,555 22.413 22,099 1,302 1.458 1,492 5.213 6,013 6.100 3.75 3.73 3.62 3.50 3.48 1,939 276 405 4.79 4.11 2,087 289 399 5.24 4.51 2,319 289 383 6.05 5.30 3.38 2,142 2,412 1,964 2.995 2,487 2,534 45,516 48,574 50,796 24,866 26,487 25,281 68.13 72.57 69.26 31.44 33 24 28.36 19 11 2009 21.54 19.10 5.17 16.9 8.30 10.65 9.98 0.55 055 0.50 285 1,373 3,936 2,442 6.69 42.67 41 20 296 1,332 4,406 2.454 6.72 44.00 43.03 8.48 1.84 0.56 279 1,091 4,216 2,307 6.32 4411 45 65 8.00 2.12 0.55 1.78 0.62 INTC AMD 2013-12 2014-12 2015-12 2013-12 2014-12 2015-12 Liquidity ratios ability to meet short term obligations Current assets CA 32,084 27,730 40,356 2.884 2,736 2,320 Inventories INV 4.172 4,273 5,167 884 685 678 Current liabilities OL 13,568 16,011 15,667 1,618 1,440 1,403 Current ratio CRECACL 1.73 2.58 1.78 1.90 1.65 Quick ratio OR (CA-INVI/CE 2.06 1.47 2.25 1.24 1.42 1.17 Asset management alios ability to generate and collect revenue fram assets Receivables AR 3,582 4,427 4,787 832 818 533 Net fixed assets FA 31,428 33,238 31,858 346 302 188 Total assets TA 92,358 91,900 103,065 4,337 2,767 3,109 Sales Sales 52,708 55,870 55,355 5,299 5,506 3,881 Average daily sales ADS=Sales/365 14441 152.07 151 66 14.52 15 OR 10.63 Days sales outstanding DSO-AR/ADS 24.81 2892 31.56 5731 54.23 5013 Days sales in inventory DSI - INV/ADS 28.89 2792 34.07 60.89 45.41 63 76 Inventory turnover ratio ITR -Sales/INV 12 13.08 10.71 5. 5.72 Fixed assets turnover ratio FATR-Sales/FA 1.68 1.68 1.74 15.32 18.23 20.64 Totalasset turnover ratio TATR-Sales/TA 0.57 0.61 0.54 1.22 1.46 1.25 Debt tenmentation Total liabilities TL 34,102 35,123 41,083 3,973 3.580 3,521 EBITDA EBITDA 20,323 23,896 22,713 339 48 -314 EBIT EBIT 12,291 15,347 14,002 103 - 155 481 Interest payments 244 192 337 177 177 160 Principal payments PP 0 0 0 0 0 Lease payments LP 270 252 253 64 59 47 Debt ratio DATLATA 0.37 0.38 0.40 0.92 0.95 113 Times interest earned TIE-EDITA 50.37 79.9) 41.55 0.58 -0.88 -3.01 EBITDA coverage ratio ECREBITDA LPMPP LP) 39.54 53.79 38.98 1.41 0.45 -1.29 Profitability ratios Navail CS N 9,620 11,704 11,420 -83 -403 -650 Totalcommon equity TCE 58.256 56,777 61,982 544 187 -412 PM-NI/Sales 0.18 0.21 0.21 -0.02 0.07 0.17 Baskeaming power BEPEBIT/TA 0.13 0.12 0.14 0.02 -0.04 0.15 EBITDA margin EBITDA /Sales 0.39 0.43 0.41 0.06 0.01 -0.08 Return on total assets ROAN/TA 0.10 0.13 0.11 0.02 -0.11 -0.21 Return on equity ROENI/ TCE 0.17 0.21 0.18 0.15 -2.16 1.60 Market value ratios Price 25.60 37.55 34.98 3.78 2.65 2.92 Price to camin 13.69 16 36 1497 N/A N/A N/A Price-to-book 2.18 3.14 267 5.04 11.00 N/A . 9429 9,408 19,382 8,247 8,700 6,990 7,230 7,550 5,776 23 5 104 0 0 0 90 91 99 0.21 0.19 0.38 314.35 1510.00 55.54 73.78 9157 34.92 1428 796 588 16 0 10 0.35 35.87 31.08 1.976 667 422 27 0 11 0.45 15.64 17.93 1,926 537 237 33 0 9 0.46 7.30 13.15 Profit margin 6,853 7,967 5,271 36,088 39,169 31,421 0.28 0.30 0.21 0.16 0.16 0.11 0.33 0.28 0.15 0.16 0.10 0.19 0.20 0.17 455 2,508 0.19 0.15 0.33 0.12 0.18 355 2,430 0.14 0.10 0.27 0.08 0.15 206 2,290 0.09 0.06 0.23 0.05 0.09 0.33 67.38 17.01 3.15 75.06 16.25 3.20 53.22 13.85 2.58 27.78 17.69 3.19 33.91 25.11 397 34.75 35.90 432 0.21 Profte margin TATR Equity multiplier Return on equity 0.61 PM - NI/Sales TATR Sales/TA EMTA/TCE ROE = PM'TATREM 0.18 0.57 159 0.17 0.21 0.54 1.66 0.18 -0.02 1.22 7.97 -0.15 -0.07 1.46 20.14 -2.16 -0.17 1.25 -7.55 1.60 0.28 0.55 1.26 0.19 162 0.21 0.30 0.55 124 0.20 0.21 0.50 1.62 0.17 0.19 0.62 1.57 0.18 0.14 0.56 1.81 0.15 0.09 0.55 1.84 0.09 Question 19 1 pts What is the measure of indebtedness? Debt ratio Times interest carned Current ratio Quick ratio D Question 20 1 pts Do you want this measure higher or lower? Higher Lower D Question 21 1 pts Which company performed best by this measure in 2015? O INTC O QCOM AMD