

Question: please help. If you are unable to answer more than one question please do not reply. this is the best I could get the picture.
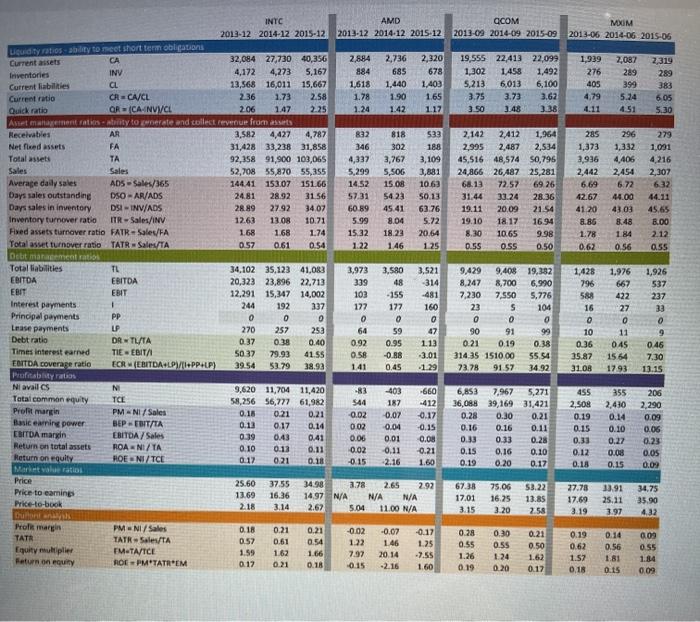
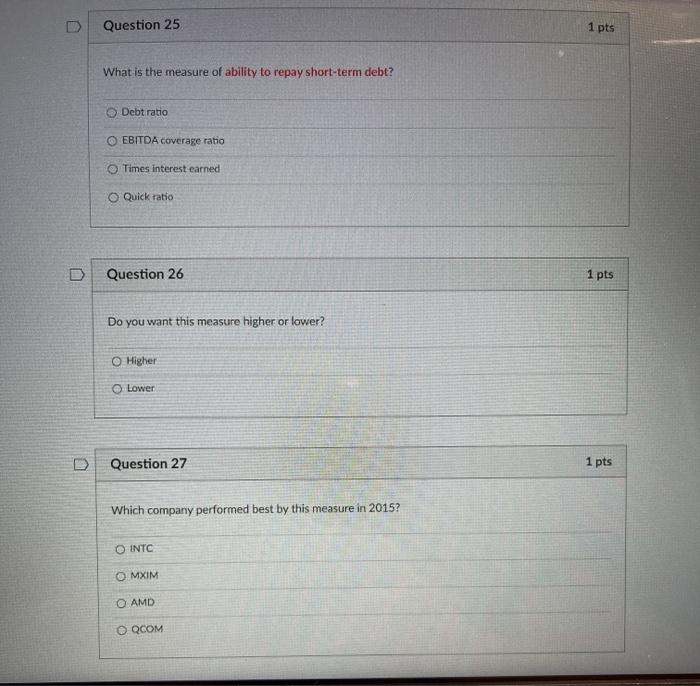
2013-09 2014-09 2015-09 MUM 2013-06 2014-06 2015-06 1,939 19,555 22,413 22,099 1,302 1.458 1,492 5.213 6,013 6.100 3.75 3.73 3.62 3.50 3.48 3.38 276 405 4.79 2,087 289 399 5.24 4.51 2319 289 383 605 5.30 2.142 2,412 1,964 2,995 2,487 2,534 45,516 48,574 S0,796 24,866 26,487 25,281 68.13 72.57 69.26 31.44 33.24 28.36 19.11 20.09 21.54 19.10 18 17 1694 8.30 10.65 9.98 0.55 0.55 0.50 285 1,373 3,936 2,442 6.69 42.67 41.20 8.86 INTC AMD 2013-12 2014-12 2015-12 2013-12 2014-12 2015-12 Liquidity ratios ability to meet short term obligations CA Current assets 2884 32,084 27,730 40,356 2,736 2,320 Inventories INV 4,172 4,273 5,167 884 685 678 Current Kabiles CL 13,568 16,011 15,667 1,618 1,440 1,403 Current ratio CRCA/CL 236 1.73 2.58 1.78 1.90 1.65 Quick ratio QR = (CAANVVCL 206 1.47 2.25 1.24 1.42 117 Aumentation to nerate and collect revenue from a Receivables AR 3,582 4,427 4,787 Ra2 818 533 Netflixed assets FA 31,428 33,238 31,858 346 302 188 Total assets TA 92,358 91,900 103,065 4,337 3,767 3,109 Sales Sales 52,708 55,870 55,355 5,299 5,506 3,881 Average daily sales ADS - Sales/365 144.41 153.07 151.66 14.52 15.08 10.63 Days sales outstanding DSO-AR/ADS 24.81 28.92 31.56 57.31 54.23 50.13 Days sales in inventory DSI INV/ADS 28.89 2792 34 07 60.89 45.41 63.76 Inventory turnover ratio ITR - Sales/INV 1263 13.08 10.71 5.99 8.04 5.72 Fred assets turnover ratio FATR-Sales/FA 1.68 1.68 1.74 15:32 18.23 20.64 Totalase turnover ratio TATR = Sales/TA 0.57 0.61 0.54 1.22 146 125 Debt management ration Total liabilities TL 34,102 35,123 41,083 3,973 3.580 3,521 EBITDA EBITDA 20,323 23.896 22,713 48 EBIT EBIT 12,291 15,347 14,002 102 - 155 Interest payments 1 244 192 337 177 177 160 Principal payments PP 0 0 0 0 0 0 Lease payments LP 270 257 253 64 59 47 Debt ratio DRTTA 0.38 0.40 0.92 0.95 1.13 Times interest earned TIE - EBIT 5037 79.93 41.55 0.58 -0.88 3.01 EBITDA coverage ratio ECREBITDAHLPi/l+PP+LP) 39.54 53.79 38.93 1.41 0.45 -1.29 Profitabuty ratos Ni avall CS N 9,620 11,704 11,420 -83 -403 -660 Tatal common equity TCE 58.256 56,777 61,982 187 -412 Profit margin PM-NI/Sales 0.18 0.21 0.21 -0.02 0.07 -0.17 Basic earrin power BEPETATA 0.13 0.17 0.14 0.02 0.04 -0.15 EBITDA margin EBITDA/ Sales 0.39 0.41 0.06 0.01 0.08 Return on total assets ROANI/TA 0.10 0.13 0.11 0.02 0.11 -0.21 Return on equity POENI/TCE 0.12 0.21 0.18 -0.15 2.16 1.60 296 1,332 4,406 2,454 6.72 44.00 43 03 8.48 184 0.56 279 1,091 4,216 2,307 6.32 44.11 45.65 8.00 2.12 0.55 1.78 0.62 319 -314 481 9.429 9.408 19,332 8,247 8,700 6.990 7.230 7.550 5.776 23 S 104 0 0 0 90 91 99 0.21 0.19 0.38 314.35 1510.00 55.54 73.78 91.57 34.92 1,428 796 588 16 O 10 0.36 35.87 31.08 1.976 667 422 27 0 11 045 15 64 1793 1,926 537 237 33 0 9 0.46 7.30 13.15 0.37 544 6,853 7,967 5,271 36,088 39,169 31,421 0.28 0.30 0.21 0.16 0.16 0.11 0.33 0.33 0.28 0.15 0,16 0.10 0.19 0.20 0.17 455 2.508 0.19 0.15 0.33 0.12 0.18 355 2,430 0.14 0.10 0.27 0.08 0.15 206 2,290 0.09 0.06 0.23 0.05 0.09 Price Price to eamine Price-to-book 25.60 13.69 2.18 37.55 16.36 3.14 3498 3.78 2.65 2.92 14.97 N/A N/A N/A 2.62 5.04 11.00 N/A 67.38 17.01 3.15 75.06 16.25 3.20 53.22 13.85 2.58 27.78 17.69 3.19 33.91 25.11 34.75 35.90 3.97 432 Prola margin TATA Equity multiplier Return on equity PMNI/Sales TATR Sales/TA FM-TA/TCE ROEPM'TATREM 0.18 0.57 1.59 017 0.21 0.61 1.62 0.21 0.21 0.54 1.66 0.18 -0.02 1.22 7.97 -0.15 -0.07 1.46 20.14 -2.16 -0.17 1.25 -7.55 1.60 0.28 0.55 1.26 0.19 0.30 0.55 1.24 0.20 0.21 0.50 1.62 0.17 0.19 0.62 1.57 0.18 0.14 0.56 1.81 0.15 0.09 0.55 1.14 0.09 Question 25 1 pts What is the measure of ability to repay short-term debt? Debt ratio O EBITDA coverage ratio Times interest earned O Quick ratio Question 26 1 pts Do you want this measure higher or lower? O Higher Lower D Question 27 1 pts Which company performed best by this measure in 2015? O INTC OMXIM O AMD O QCOM
Step by Step Solution
There are 3 Steps involved in it

Get step-by-step solutions from verified subject matter experts