

Question: please help. If you are unable to answer more than one question please do not reply. this is the best I could get the picture.
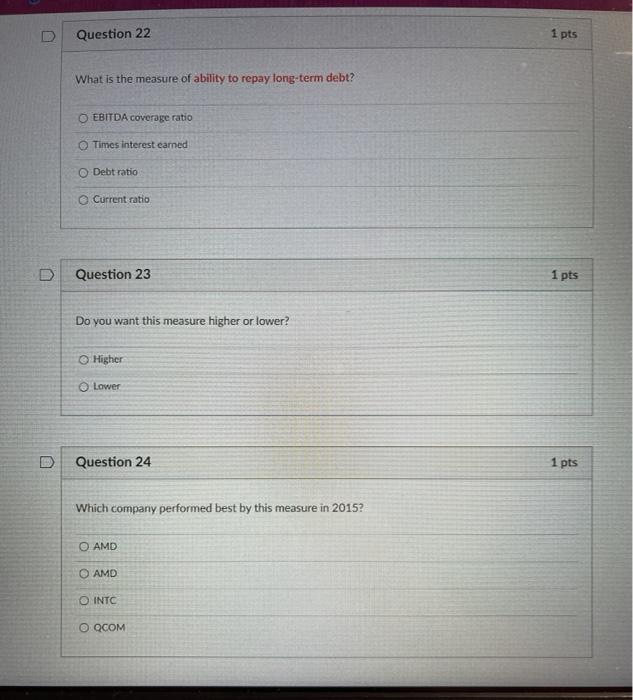
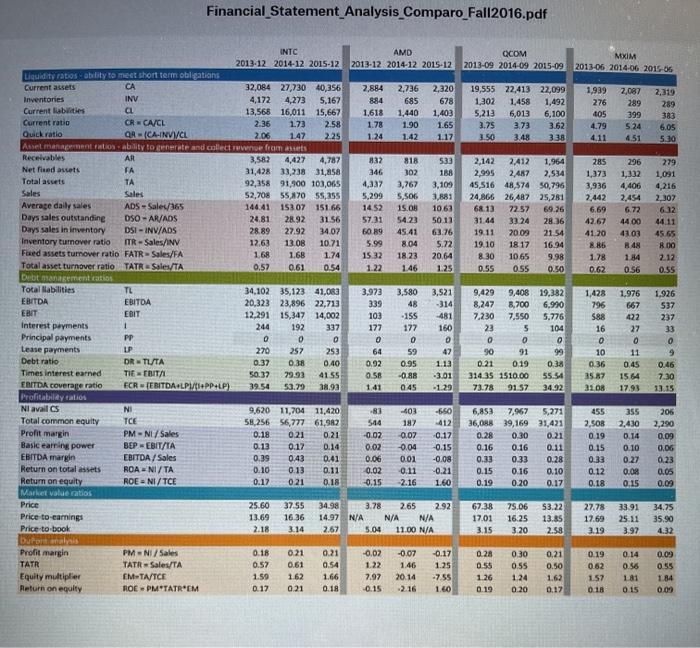
Question 22 1 pts What is the measure of ability to repay long-term debt? EBITDA coverage ratio Times interest earned O Debt ratio Current ratio Question 23 1 pts Do you want this measure higher or lower? Higher Lower Question 24 1 pts Which company performed best by this measure in 2015? O AMD O AMD O INTC O QCOM Financial Statement Analysis Comparo Fall2016.pdf 205 818 3,767 27.92 INTC AMD QCOM 2013-12 2014-12 2015-12 2013-12 2014-12 2015-12 2013-09 2014-09 2015-09 2013-06 2014-06 2015-06 MXIM Liquidity ratios ability to meet short term obligations Current assets CA 32,084 27,730 40,356 2,884 2,736 2,320 19,555 22,413 22,099 1,939 2,087 2,319 Inventories INV 4,172 4,273 5.167 884 685 678 1.302 1,458 1,492 276 289 Current abilities a 289 13,568 16,011 15,667 1,618 1,440 1,403 5,213 6,013 6,100 105 399 383 Current ratio CRCA/CL 2.36 173 258 1.78 1.90 1.65 3.75 3.73 3.62 4.79 Quick ratio 524 QA (CA-INVVCL 6.05 147 2.25 1.24 1.42 1.17 11.50 3.48 3.38 4.11 4.51 5.30 Anel mentionability to generate and collective frames Receivables AR 3,562 4,427 4,787 832 533 2,142 2,412 1,964 285 296 279 Net fired assets TA 31,428 33,238 31,858 346 302 188 2,995 2.487 2,534 1,373 1,332 Total assets 1,091 TA 92,358 91,900 103,065 4,337 3,109 45,516 48,574 50,796 3,936 4,406 4,216 Sales Sales 52,708 55,870 55,355 5,299 5,506 3,681 24,866 26,487 25,281 2,442 2,454 2.307 Average daily sales ADS - Sales/365 144.41 15307 151.66 1452 15.08 1063 68.13 7257 69.26 6.69 6.72 632 Days sales outstanding OSO - AR/ADS 24.81 28.92 31.56 57.31 54.23 50.11 31.44 33 24 28.36 42.67 4400 44. 11 Days sales in inventory DSI - INV/ADS 28.89 60.89 45.41 63.76 19.11 2003 21.54 41.20 43.03 45.65 Inventory turnover ratio ITR - Sales/INV 12.63 13.08 10.71 5.99 8.04 5.72 19.10 18 17 16.94 8.85 848 8.00 Faxed assets turnover ratio FATR-Sales/FA 1.68 1.68 1.74 15 32 18.23 20.64 8.30 10.65 9.98 1.78 1 84 2.12 Total asset turnover ratio TATR Sales/TA 0.52 0.61 0.54 1.22 146 1.25 0.55 0.55 0.50 0.62 0.56 0.55 Debt managementatios Total abilities TL 34.102 35,123 41,083 3,973 3,580 3,521 9,429 9,408 19,382 1,428 1,976 1.926 EBITDA EBITDA 20,323 23,896 22,713 339 48 -314 8,247 8,700 6.990 796 667 537 EBIT EBIT 12,291 15,347 14,002 103 -155 -481 7.230 7.550 5.776 588 422 237 Interest payments 1 244 192 337 177 177 160 23 5 104 16 27 33 Principal payments PP 0 0 O 0 0 0 0 0 0 0 O 0 Lease payments UP 257 253 64 59 47 90 91 99 10 11 9 Debt ratio DR TUTA 0.37 0.38 0.40 0.92 0.95 1.13 0.21 019 0.38 0.36 0.45 0.46 Times interest earned TIE BITI 50.32 29.93 4155 0.58 -0.88 -3.01 314 35 1510.00 55.54 35.87 1584 7.30 EBITDA coverare ratio FOREBITDALP/PPP) 39.54 53.79 38.93 1.41 045 -1.29 73.78 91.57 34.92 31.08 17.93 13 15 Profitabilnycaties Niavail CS NI 9,620 11,704 11.420 -83 403 -650 6,853 7.967 5,271 455 355 206 Total common equity TCE 58.256 56,777 61.982 544 187 412 36,088 39,16931,421 2,508 2,430 2,290 Profit margin PM - NI/Sales 0.21 0.21 -0.02 -0.07 0.12 0.28 0.30 0.21 0.19 0.14 0.09 Basic earning power BEP HIT/ 0.13 0.17 0.14 0.02 -0.04 -0.15 0.16 0.16 0.11 0.15 0.10 EBITDA margin EBITDA /Sales 0.39 0.43 0.41 0.06 0.01 -0.08 0.33 0.33 0.28 0.33 0.27 0.23 Return on total assets ROANI/TA 0.10 0.13 0.11 0.02 0.11 -0.21 0.15 0.16 0.10 0.12 0.08 0.05 Return on equity ROENI/ TCE 0.1% 021 0.18 -0.15 -2.16 1.60 0.19 0.20 0.17 0.18 0.15 0.09 Market value ratios 25.60 37.55 34.98 3.78 2.65 2.92 67.38 75.06 53.22 27.78 33.91 34.75 Price to earnings 13.69 16 36 14.97 N/A N/A N/A 17.01 16.25 13.85 17.69 25.11 35.90 Price to book 2.18 3.14 2.67 5.04 11.00 N/A 3.15 3.20 2.58 3.19 3.97 4.32 bufor nabos Profit margin PM N /Sales 0.18 0.21 -0.02 -0.07 0.17 0.28 0.30 0.21 0.19 0.14 0.09 TATR TATR Sales/TA 0.57 0.61 0.54 1.22 1.46 1.25 0.55 0.55 0.50 0.62 0.36 0.55 Equity multiplier EM-TA/TCE 1.59 1.62 1.66 7.97 -7.55 1.26 1.24 1.62 1.57 1 81 1.84 Return on equity ROEPM TATREM 0.17 0.21 0.18 0.15 1.60 0.19 0.20 0.17 0.18 0.15 0.09 270 0.18 0.06 Price 0.21 2014
Step by Step Solution
There are 3 Steps involved in it

Get step-by-step solutions from verified subject matter experts