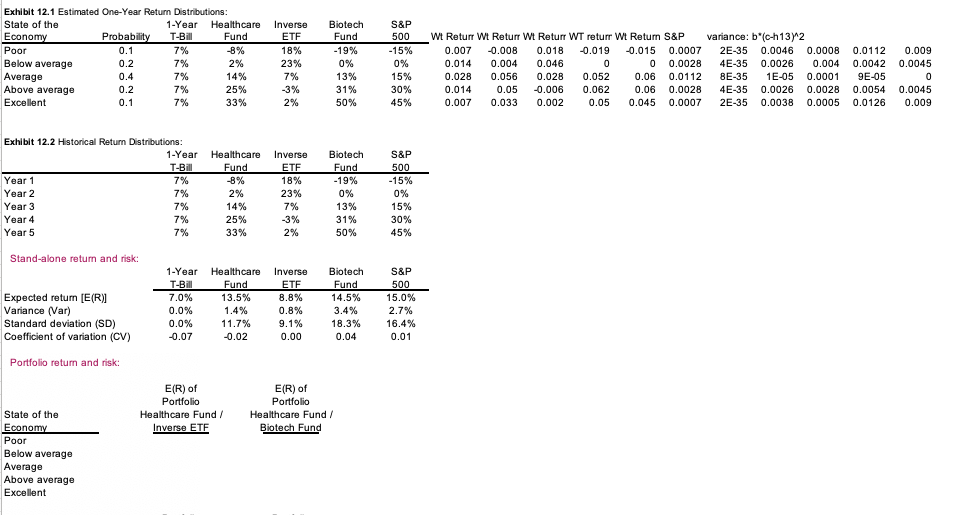
Question: Please use Excel for answer Exhibit 12.1 Estimated One-Year Return Distributions: State of the 1-Year Healthcare Inverse Biotech S&P Economy Probability T-Bill Fund ETF Fund

Please use Excel for answer

Please use Excel for answer Exhibit 12.1
Exhibit 12.1 Estimated One-Year Return Distributions: State of the 1-Year Healthcare Inverse Biotech S&P Economy Probability T-Bill Fund ETF Fund 500 Wt Return Wt Retur Wt Return WT return Wt Retum S&P variance: b*(c-h13)^2 Poor D. 1 7% 8% 18% 19% -15% 0.007 -0.008 0.018 -0.019 -0.015 0.0007 2E-35 0.0046 0.0008 0.0112 0.009 Below average 0.2 7% 2% 23% 0% 0% 0.014 0.004 0.046 0 0 0.0028 4E-35 0.0026 0.004 0.0042 0.0045 Average 0.4 7% 14% 7% 13% 15% 0.028 0.056 0.028 0.052 0.06 0.0112 BE-35 1E-05 0.0001 9E-05 Above average 0.2 7% 25% -3% 31% 30% 0.014 0.05 -0.006 0.062 0.06 0.0028 4E-35 0.0026 0.0028 0.0054 0.0045 Excellent 0.1 7% 33% 2% 50% 45% 0.007 0.033 0.002 0.05 0.045 0.0007 2E-35 0.0038 0.0005 0.0126 0.009 Exhibit 12.2 Historical Return Distributions: 1-Year Healthcare Inverse Biotech S&P T-Bill Fund ETF Fund 500 Year 1 7% 8% 18% -19% -15% Year 2 7% 2% 23% 0% 0% Year 3 7% 14% 7% 13% 15% Year 4 7% 25% -3% 31% 30% Year 5 7% 33% 2% 50% 45% Stand-alone retum and risk: 1-Year Healthcare Inverse Biotech S&P T-Bill Fund ETF Fund 500 Expected retum [E(R)] 7.0% 13.5% 8.8% 14.5% 15.0% Variance (Var) 0.0% 1.4% 0.8% 3.4% 2.7% Standard deviation (SD) 0.0% 11.7% 9.1% 18.3% 16.4% Coefficient of variation (CV) -0.07 -0.02 0.00 0.04 0.01 Portfolio return and risk: E(R) of E(R) of Portfolio Portfolio State of the Healthcare Fund / Healthcare Fund / Economy Inverse ETE Biotech Fund Poor Below average Average Above average Excellent

Step by Step Solution

There are 3 Steps involved in it

1 Expert Approved Answer
Step: 1 Unlock blur-text-image
Question Has Been Solved by an Expert!

Get step-by-step solutions from verified subject matter experts

Step: 2 Unlock
Step: 3 Unlock

Students Have Also Explored These Related Finance Questions!