

Question: Plot the grain size distribution curve and classify the soils according to both USCS and AASHTO. 2 . 6 5 A sample of soil was
Plot the grain size distribution curve and classify the soils according to both USCS and AASHTO.
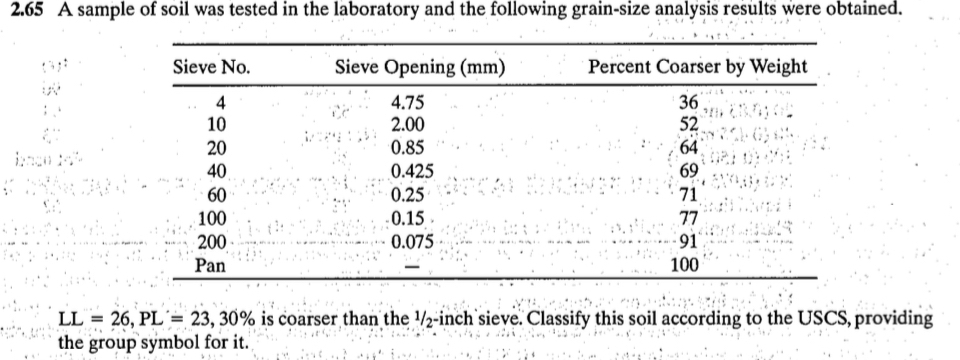
A sample of soil was tested in the laboratory and the following grainsize analysis results were obtained.
is coarser than the inch sieve. Classify this soil according to the USCS, providing
the group symbol for it
Step by Step Solution
There are 3 Steps involved in it
1 Expert Approved Answer
Step: 1 Unlock

Question Has Been Solved by an Expert!
Get step-by-step solutions from verified subject matter experts
Step: 2 Unlock
Step: 3 Unlock