

Question: Plot the grain size distribution curve and classify the souls according to both USCS and AASHTO. 2 . 7 0 A sample of soil was
Plot the grain size distribution curve and classify the souls according to both USCS and AASHTO.
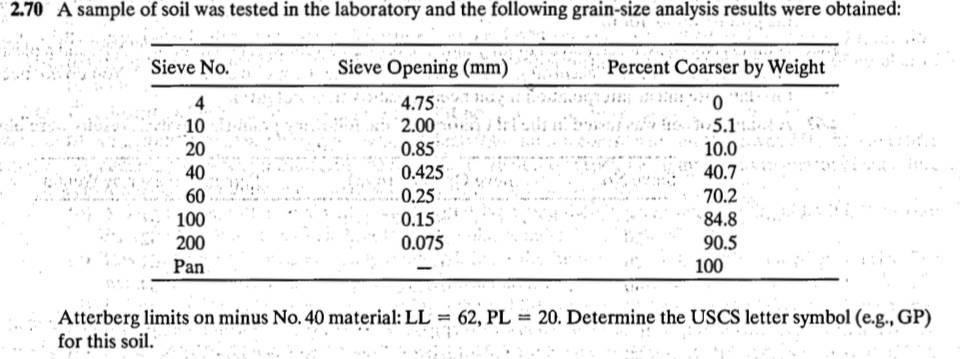
A sample of soil was tested in the laboratory and the following grainsize analysis results were obtained:
Atterberg limits on minus No material: Determine the USCS letter symbol eg GP
for this soil.
Step by Step Solution
There are 3 Steps involved in it
1 Expert Approved Answer
Step: 1 Unlock

Question Has Been Solved by an Expert!
Get step-by-step solutions from verified subject matter experts
Step: 2 Unlock
Step: 3 Unlock