

Question: Q.7 The data shown in Table I are X and R values for 15 samples. Set up X and R charts on this process.
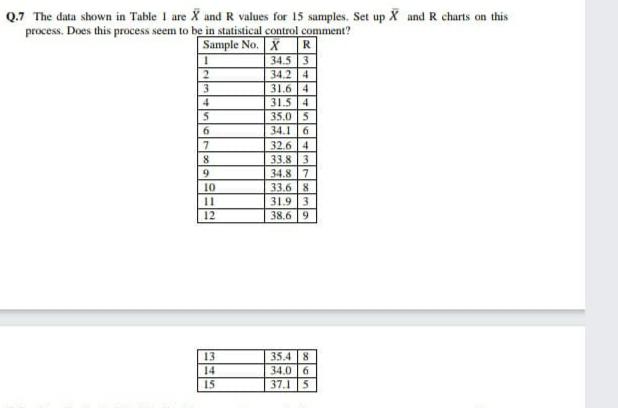
Q.7 The data shown in Table I are X and R values for 15 samples. Set up X and R charts on this process. Does this process seem to be in statistical control comment? Sample No. X R 34.5 3 34.2 4 31.6 4 31.5 4 35.0 5 34.1 6 32.6 4 33.8 |3 34.8 7 33.6 8 31.9 3 38.6 | 9 3. 4 7. 8. 10 12 35.4 8 34.0 6 37.1 5 13 14 15
Step by Step Solution
★★★★★
3.34 Rating (160 Votes )
There are 3 Steps involved in it
1 Expert Approved Answer
Step: 1 Unlock

The Xbar and R control charts can be determined as follo... View full answer
Question Has Been Solved by an Expert!
Get step-by-step solutions from verified subject matter experts
Step: 2 Unlock
Step: 3 Unlock