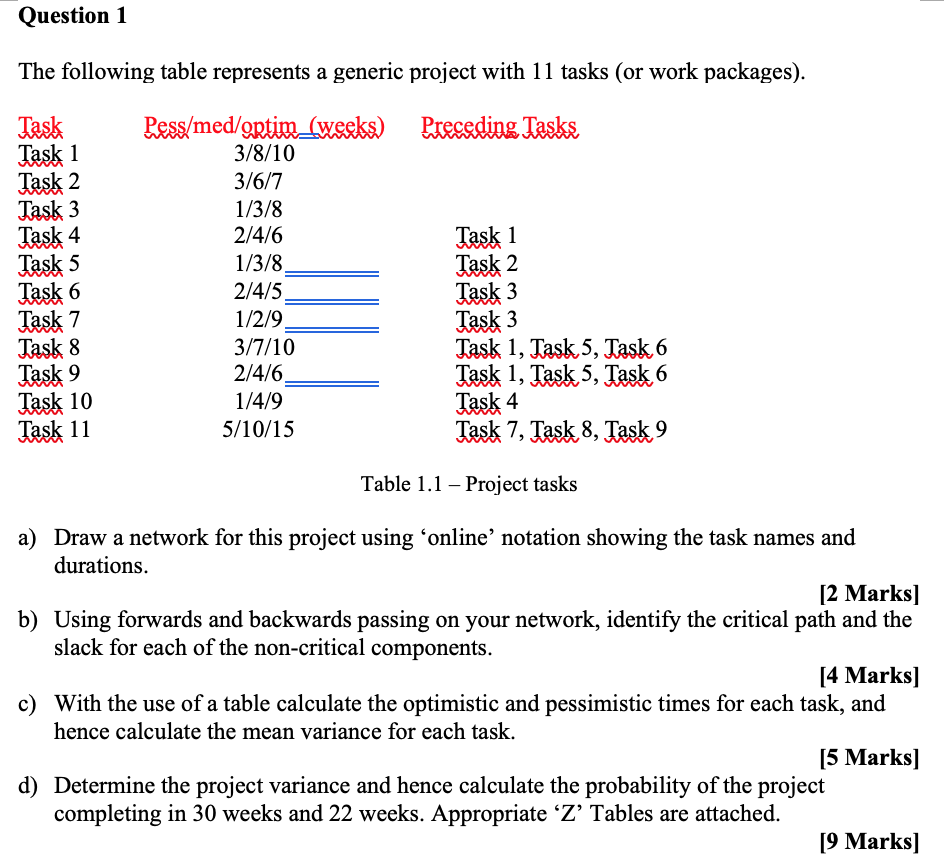
Question: Question 1 The following table represents a generic project with 11 tasks (or work packages). Task Task 1 Task 2 Task 3 Task 4 Task

Question 1 The following table represents a

Question 1 The following table represents a generic project with 11 tasks (or work packages). Task Task 1 Task 2 Task 3 Task 4 Task 5 Task 6 Task 7 Task 8 Task 9 Task 10 Task 11 Pess/med/optim_weeks) Preceding Tasks 3/8/10 3/6/7 1/3/8 2/4/6 Task 1 1/3/8 Task 2 2/4/5 Task 3 1/2/9 Task 3 3/7/10 Task 1, Task 5, Task 6 2/4/6 Task 1, Task 5, Task 6 1/4/9 5/10/15 Task 7, Task 8, Task 9 Task 4 Table 1.1 - Project tasks a) Draw a network for this project using 'online' notation showing the task names and durations. [2 Marks] b) Using forwards and backwards passing on your network, identify the critical path and the slack for each of the non-critical components. [4 Marks] c) With the use of a table calculate the optimistic and pessimistic times for each task, and hence calculate the mean variance for each task. [5 Marks] d) Determine the project variance and hence calculate the probability of the project completing in 30 weeks and 22 weeks. Appropriate Z Tables are attached. [9 Marks]

Step by Step Solution

There are 3 Steps involved in it

1 Expert Approved Answer
Step: 1 Unlock blur-text-image
Question Has Been Solved by an Expert!

Get step-by-step solutions from verified subject matter experts

Step: 2 Unlock
Step: 3 Unlock

Students Have Also Explored These Related General Management Questions!