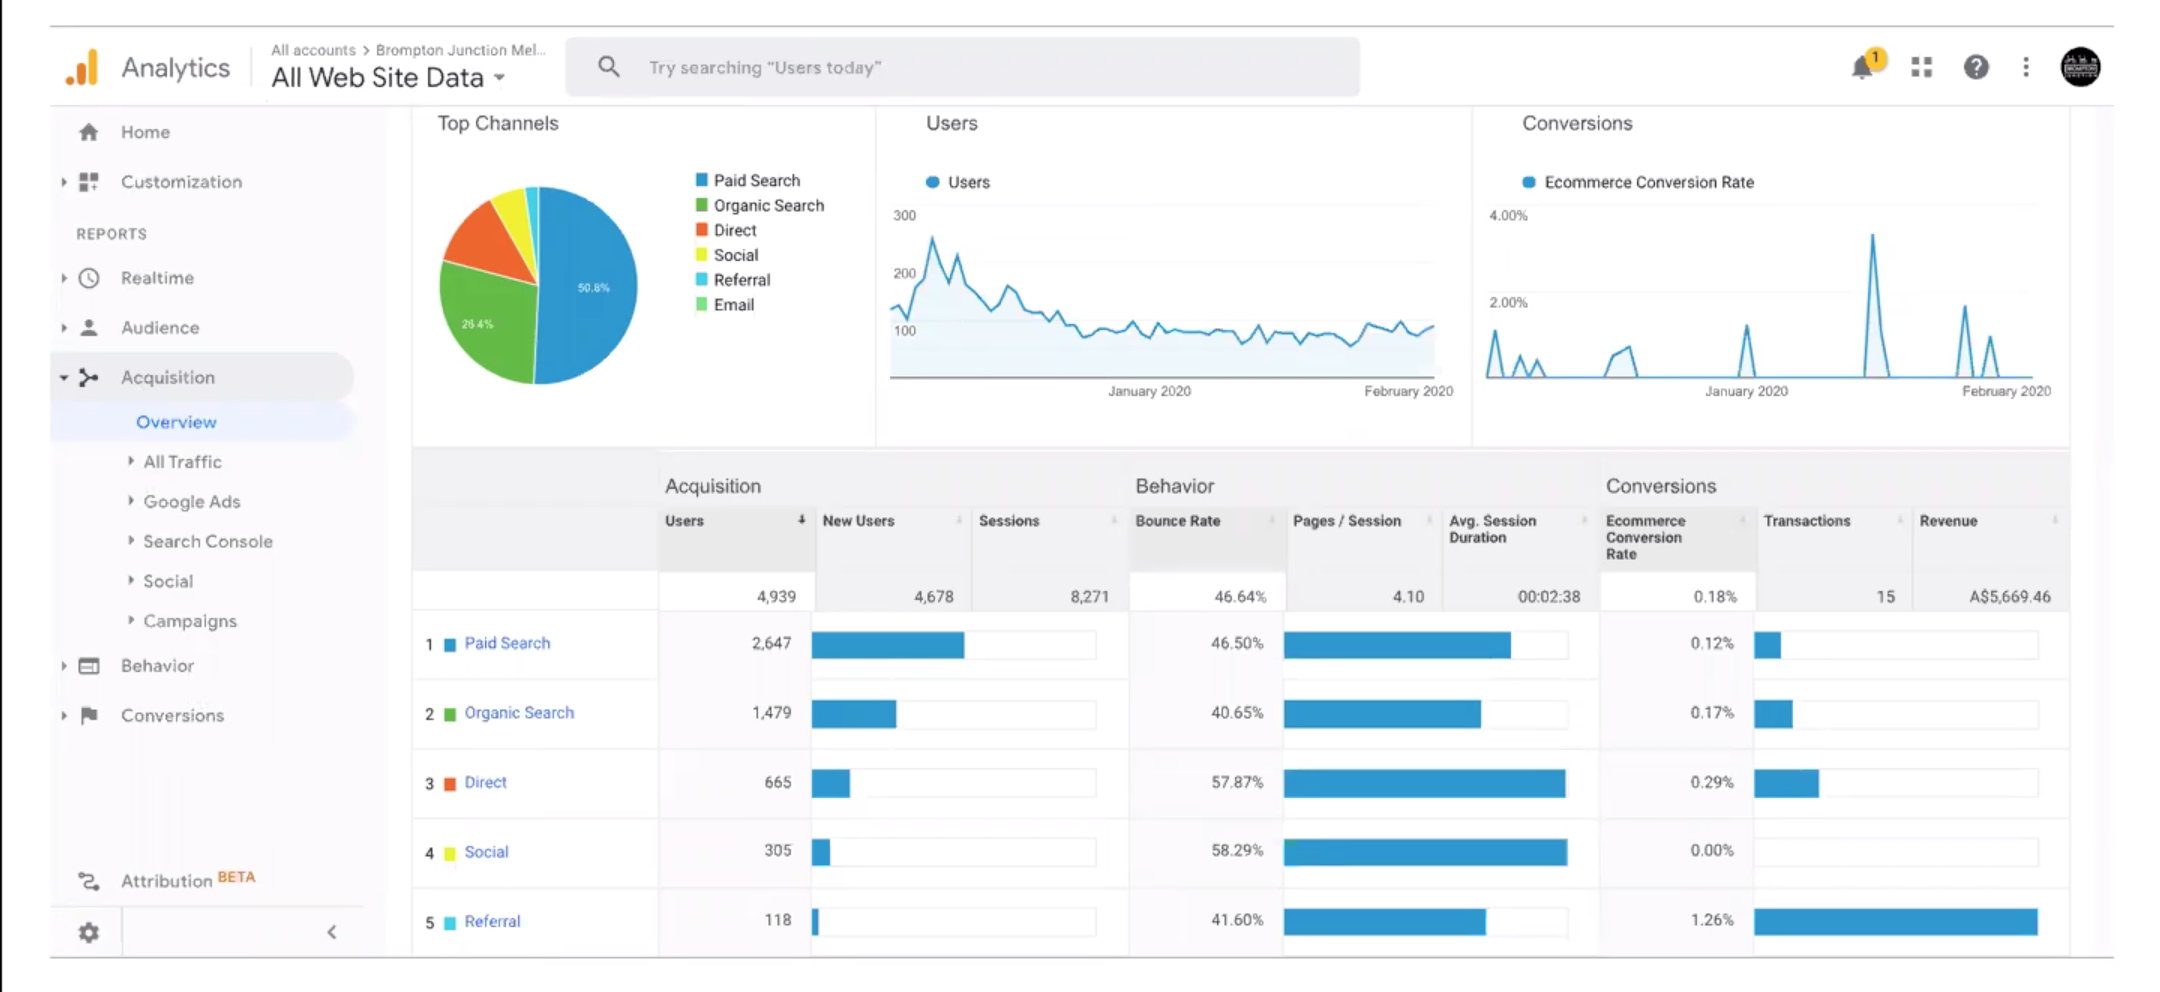
Question: Question 14) The graph provided shows some metrics from Google Analytics to analyse acquisition of users, their behaviour and E-Commerce conversion rate for an e-commerce

Question 14) The graph provided shows someQuestion 14) The graph provided shows some

Question 14) The graph provided shows some metrics from Google Analytics to analyse acquisition of users, their behaviour and E-Commerce conversion rate for an e-commerce website. Compare the efficiency of the following channels generating visits on the website: paid search and referral. (You must compare the efficiency in terms of acquisition of users and conversion rate). Question 15) Based on the value of the bounce rates indicated in the graph , what would you recommend to the e-commerce company to increase online transactions? (Your answer should be related to the bounce rate.) Analytics All accounts > Brompton Junction Mel.. All Web Site Data Q Try searching "Users today" Users Home Top Channels Conversions Customization Users Ecommerce Conversion Rate 300 4.00% REPORTS Paid Search Organic Search Direct Social Referral Email 200 Realtime 50.8% 2.00% Audience 28 4% 100 Aun Acquisition January 2020 February 2020 January 2020 February 2020 Overview All Traffic Acquisition Behavior Conversions Google Ads Users New Users Sessions Bounce Rate Pages / Session Transactions Revenue Avg. Session Duration Search Console Ecommerce Conversion Rate Social 4,939 4,678 8,271 46.64% 4.10 00:02:38 0.18% 15 A$5,669.46 Campaigns 1 Paid Search 2,647 46.50% 0.12% Behavior Conversions 2 Organic Search 1,479 40.65% 0.17% 3 Direct 665 57.87% 0.29% 4 Social 305 58.29% 0.00% 2 Attribution BETA 5 Referral o 41.60% 1181 1.26%

Step by Step Solution

There are 3 Steps involved in it

1 Expert Approved Answer
Step: 1 Unlock blur-text-image
Question Has Been Solved by an Expert!

Get step-by-step solutions from verified subject matter experts

Step: 2 Unlock
Step: 3 Unlock

Students Have Also Explored These Related General Management Questions!