

Question: QUESTION 6 a) Table Q6(a) shows the activities, immediate predecessors and the activity durations of a project. Draw an AON diagram of the project. ii)
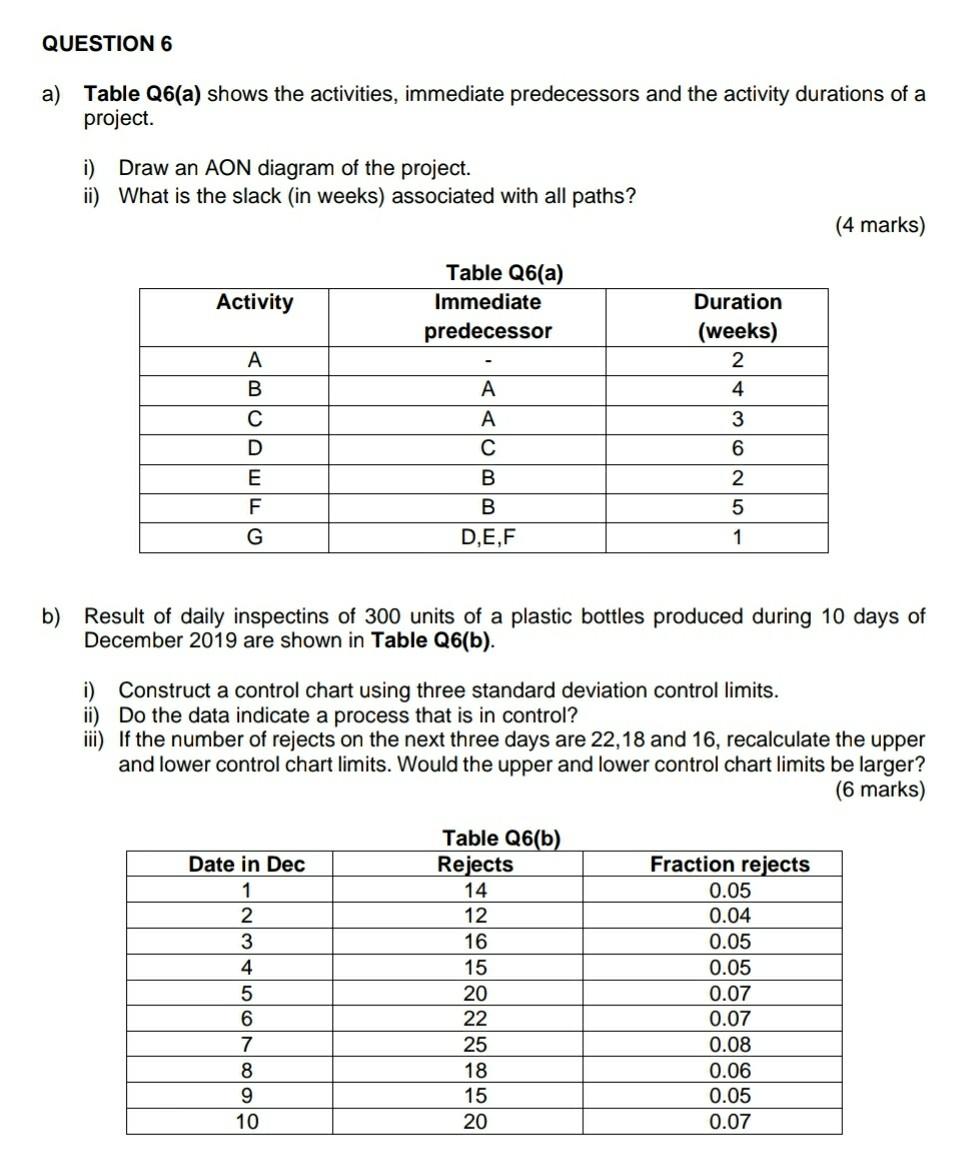
QUESTION 6 a) Table Q6(a) shows the activities, immediate predecessors and the activity durations of a project. Draw an AON diagram of the project. ii) What is the slack (in weeks) associated with all paths? (4 marks) Activity Table Q6(a) Immediate predecessor Duration (weeks) 2 - A B A 4 C 3 6 D E B 2 5 F G B D,E,F 1 b) Result of daily inspectins of 300 units of a plastic bottles produced during 10 days of December 2019 are shown in Table Q6(b). i) Construct a control chart using three standard deviation control limits. ii) Do the data indicate a process that is in control? iii) If the number of rejects on the next three days are 22,18 and 16, recalculate the upper and lower control chart limits. Would the upper and lower control chart limits be larger? (6 marks) Date in Dec 1 2 3 4 5 6 7 8 9 10 Table Q6(b) Rejects 14 12 16 15 20 22 25 18 15 20 Fraction rejects 0.05 0.04 0.05 0.05 0.07 0.07 0.08 0.06 0.05 0.07
Step by Step Solution
There are 3 Steps involved in it
1 Expert Approved Answer
Step: 1 Unlock

Question Has Been Solved by an Expert!
Get step-by-step solutions from verified subject matter experts
Step: 2 Unlock
Step: 3 Unlock