

Question: Refer to Table S 6 . 1 - Factors for Computing Control Chart Limits ( 3 sigma ) for this problem. Thirty - five samples
Refer to Table S Factors for Computing Control Chart Limits sigma for this problem.
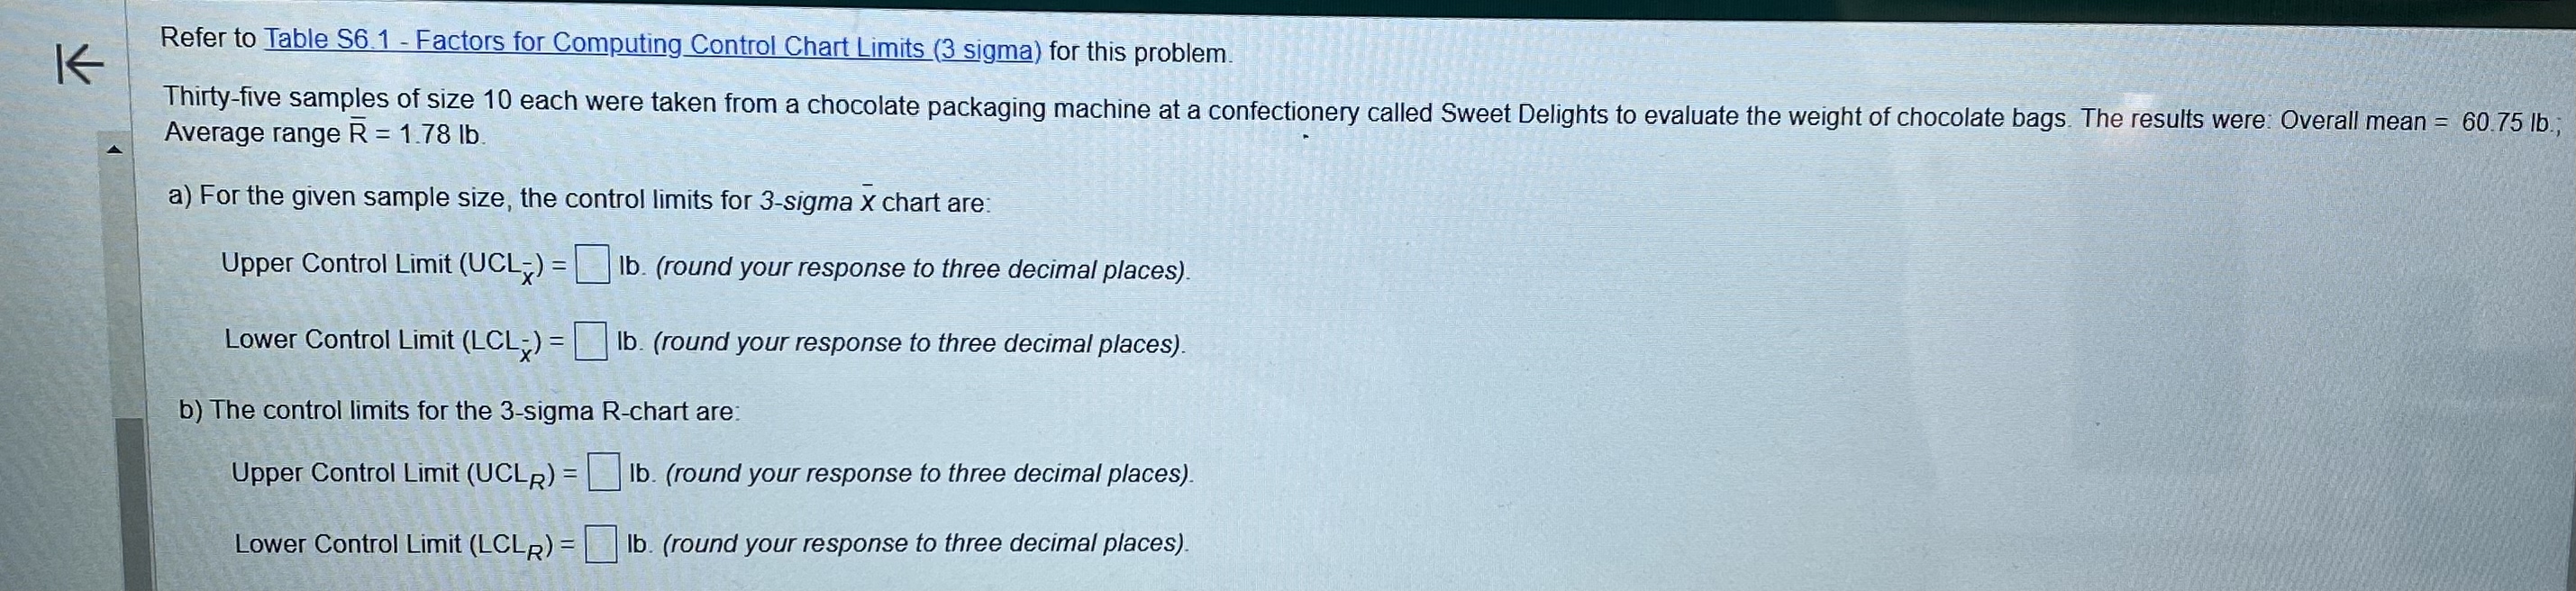
Thirtyfive samples of size each were taken from a chocolate packaging machine at a confectionery called Sweet Delights to evaluate the weight of chocolate bags. The results were: Overall mean ; Average range
a For the given sample size, the control limits for sigma chart are:
Upper Control Limit Ibround your response to three decimal places
Lower Control Limit Ibround your response to three decimal places
b The control limits for the sigma Rchart are:
Upper Control Limit Ibround your response to three decimal places
Lower Control Limit Ibround your response to three decimal places
Step by Step Solution
There are 3 Steps involved in it
1 Expert Approved Answer
Step: 1 Unlock

Question Has Been Solved by an Expert!
Get step-by-step solutions from verified subject matter experts
Step: 2 Unlock
Step: 3 Unlock