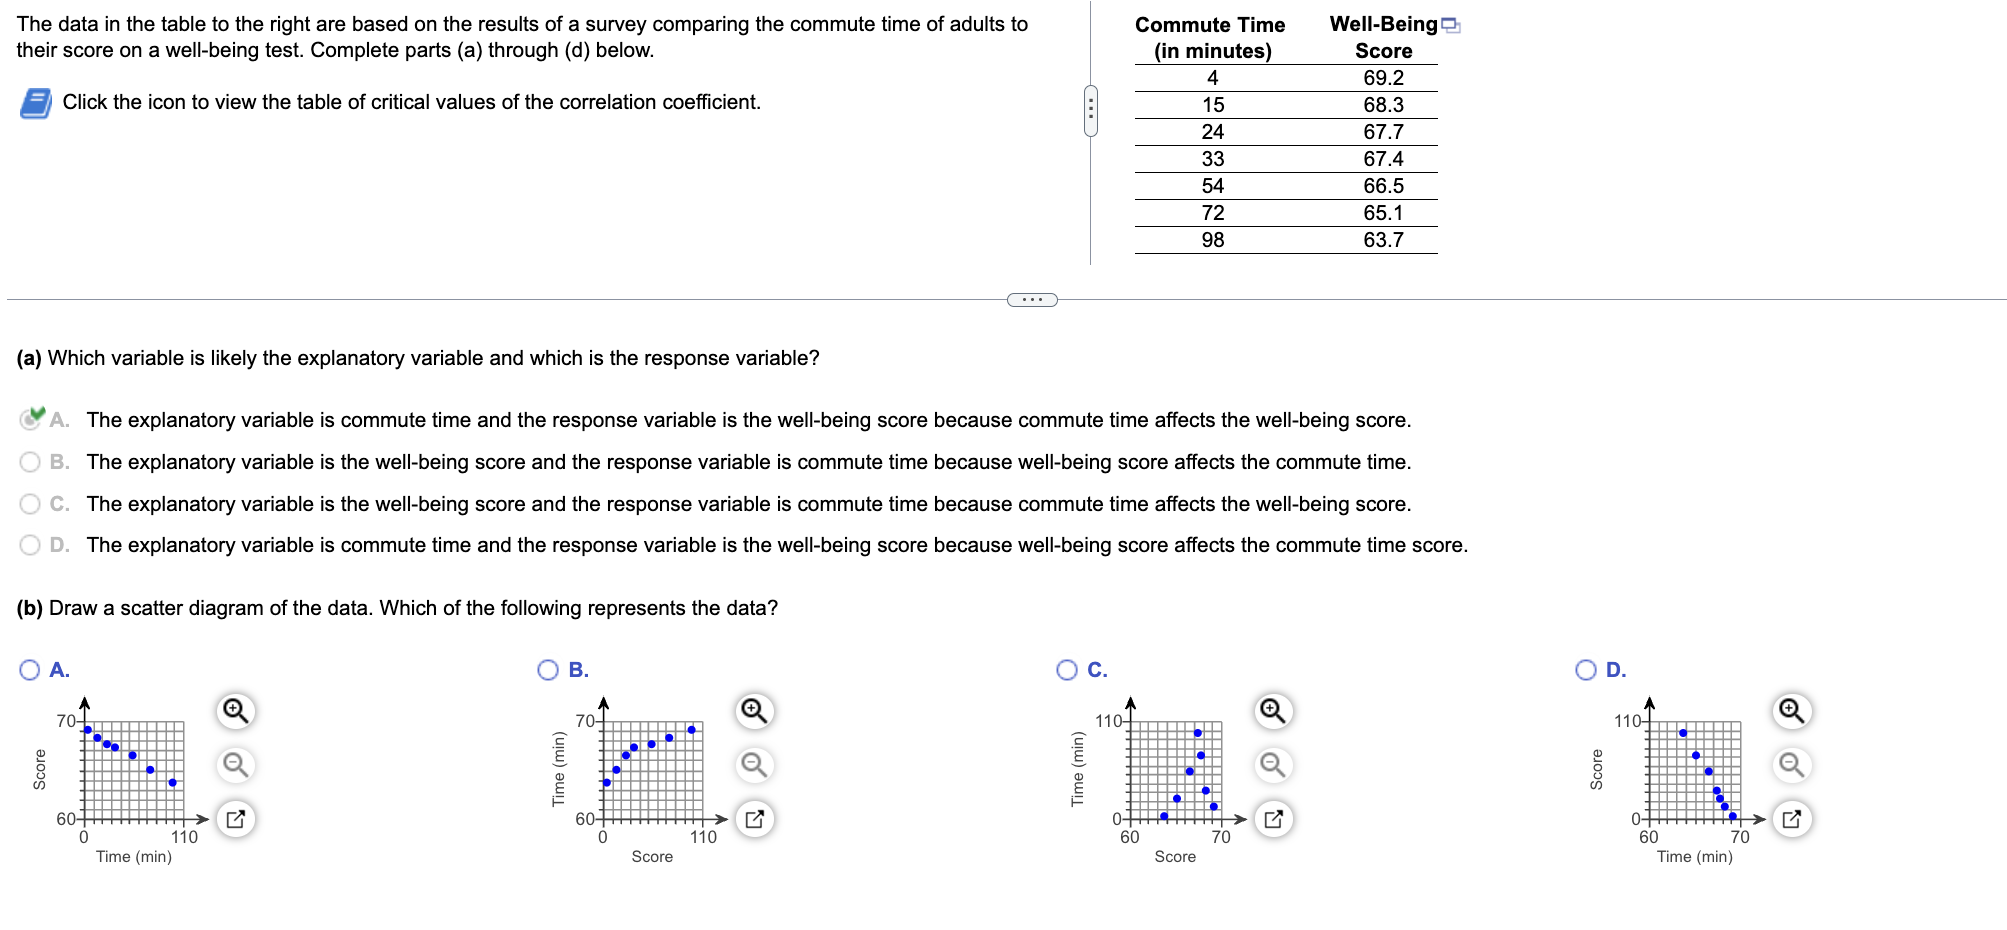
Question: The data in the table to the right are based on the results of a survey comparing the commute time of adults to Commute Time

The data in the table to the right are based onThe data in the table to the right are based on
The data in the table to the right are based on the results of a survey comparing the commute time of adults to Commute Time Well-Being their score on a well-being test. Complete parts (a) through (d) below. ' (in minutes) Score 4 69.2 Q Click the icon to view the table of critical values of the correlation coefficient. H 15 68.3 U 24 67.7 33 67.4 54 66.5 72 65.1 98 63.7 (a) Which variable is likely the explanatory variable and which is the response variable? v The explanatory variable is commute time and the response variable is the well-being score because commute time affects the well-being score. The explanatory variable is the well-being score and the response variable is commute time because well-being score affects the commute time. The explanatory variable is the well-being score and the response variable is commute time because commute time affects the well-being score. The explanatory variable is commute time and the response variable is the well-being score because well-being score affects the commute time score. (b) Draw a scatter diagram of the data. Which of the following represents the data? O A O ( 70 } Q Q o o g Q 5 Q s Q 8 2 e 8 i = 60 =z & =z 0 110 0 110 60 70 Time (min) Score Score Time (min) \f

Step by Step Solution

There are 3 Steps involved in it

1 Expert Approved Answer
Step: 1 Unlock blur-text-image
Question Has Been Solved by an Expert!

Get step-by-step solutions from verified subject matter experts

Step: 2 Unlock
Step: 3 Unlock

Students Have Also Explored These Related Mathematics Questions!