

Question: The following are quality control data for a manufacturing process at Kensport Chemical Company. The data show the temperature in degrees centigrade at five points
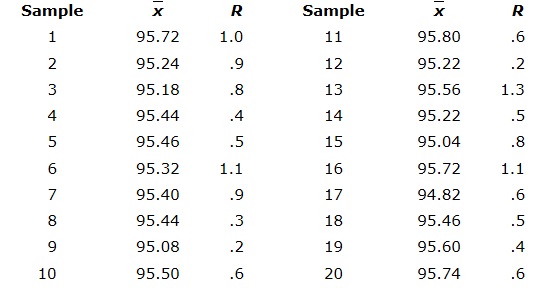
The following are quality control data for a manufacturing process at Kensport Chemical Company. The data show the temperature in degrees centigrade at five points in time during a manufacturing cycle. The company is interested in using control charts to monitor the temperature of its manufacturing process. a) compute R-bar and X-bar. b) What is the upper control limit and lower control limit for the R chart (to 2 decimals)? c) What is the upper control limit and lower control limit for the X-bar chart (to 2 decimals)?
\f
Step by Step Solution
There are 3 Steps involved in it
1 Expert Approved Answer
Step: 1 Unlock

Question Has Been Solved by an Expert!
Get step-by-step solutions from verified subject matter experts
Step: 2 Unlock
Step: 3 Unlock