

Question: The following are quality control data for a manufacturing process at Kensport Chemical Company. The data show the temperature in degrees centigrade at five points

The following are quality control data for a manufacturing process at Kensport Chemical Company. The data show the temperature in degrees centigrade at five points in time during a manufacturing cycle.
| Sample | x | R |
| 1 | 95.72 | 1.0 |
| 2 | 95.24 | 0.9 |
| 3 | 95.18 | 0.8 |
| 4 | 95.48 | 0.4 |
| 5 | 95.46 | 0.5 |
| 6 | 95.32 | 1.1 |
| 7 | 95.40 | 0.8 |
| 8 | 95.44 | 0.3 |
| 9 | 95.08 | 0.2 |
| 10 | 95.50 | 0.6 |
| 11 | 95.80 | 0.6 |
| 12 | 95.22 | 0.2 |
| 13 | 95.58 | 1.3 |
| 14 | 95.22 | 0.4 |
| 15 | 95.04 | 0.8 |
| 16 | 95.72 | 1.1 |
| 17 | 94.82 | 0.6 |
| 18 | 95.46 | 0.5 |
| 19 | 95.60 | 0.4 |
| 20 | 95.74 | 0.6 |
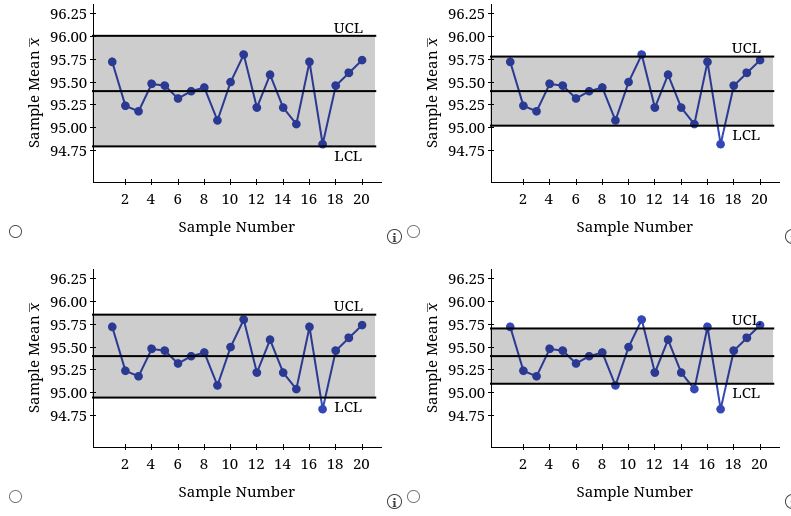
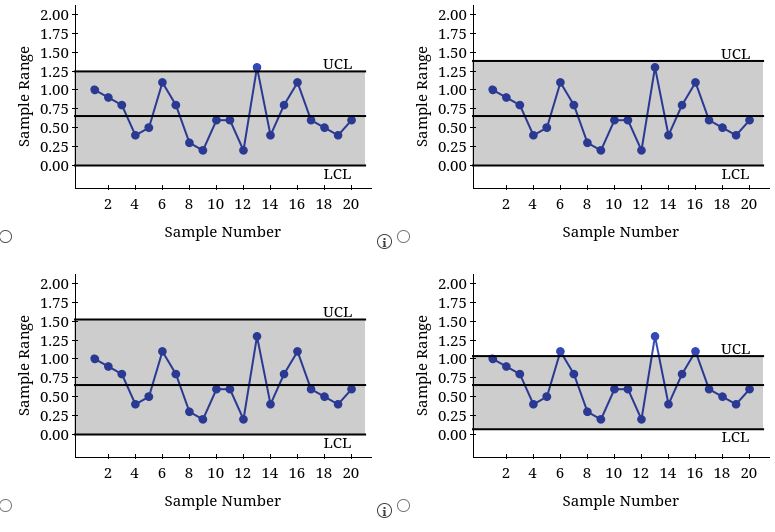
The company is interested in using control charts to monitor the temperature of its manufacturing process. Compute the upper and lower control limits for the R chart. (Round your answers to three decimal places.)
UCL = __________
LCL = __________
Construct the R chart.

Sample Range Sample Range 2.0:} ' 1.?5 1.50 1.25 1.00 0.25 0.50 0.25 0.00 2.00 1.?5 1.50 1.25 1.00 0.?5 0.50 0.25 0.00 'LCCL 2 4 0 3 101214101320 Sample Number LEI. 2 4 0 3 101214101320 Sample Number @0 @0 Sample Range Sample Range 2.00 1.?5 1.50 1.25 1.00 0.?5 0.50 0.25 0.00 2.00 1.?5 1.50 1.25 1.00 0.75 0.50 0.25 0.00 LCL 2 4 0 3101214101320 Sample Number LEI. 2 4 0 3101214101320 Sample Number Sample Mean Tc Sample Mean 7: 96.25 96.60 95.25 95.59 95.25 95.66I 94.25 96.25 96.99 95.?5 95.50I 95.25 95-90 94.25 2 4 6 B 161214161826 Sample Number 2 4 6 B 161214161826 Sample Number (30 (BO Sample Mean Tr Sample Mean Tr 96.25 2 4 a 3 10121416132!) Sample Number 2 4 6 3 16121416132!) Sample Number
Step by Step Solution
There are 3 Steps involved in it

Get step-by-step solutions from verified subject matter experts