

Question: The rectangles in the graph below illustrate a right endpoint Riemann sum for f ( x ) = x 2 1 1 on the interval
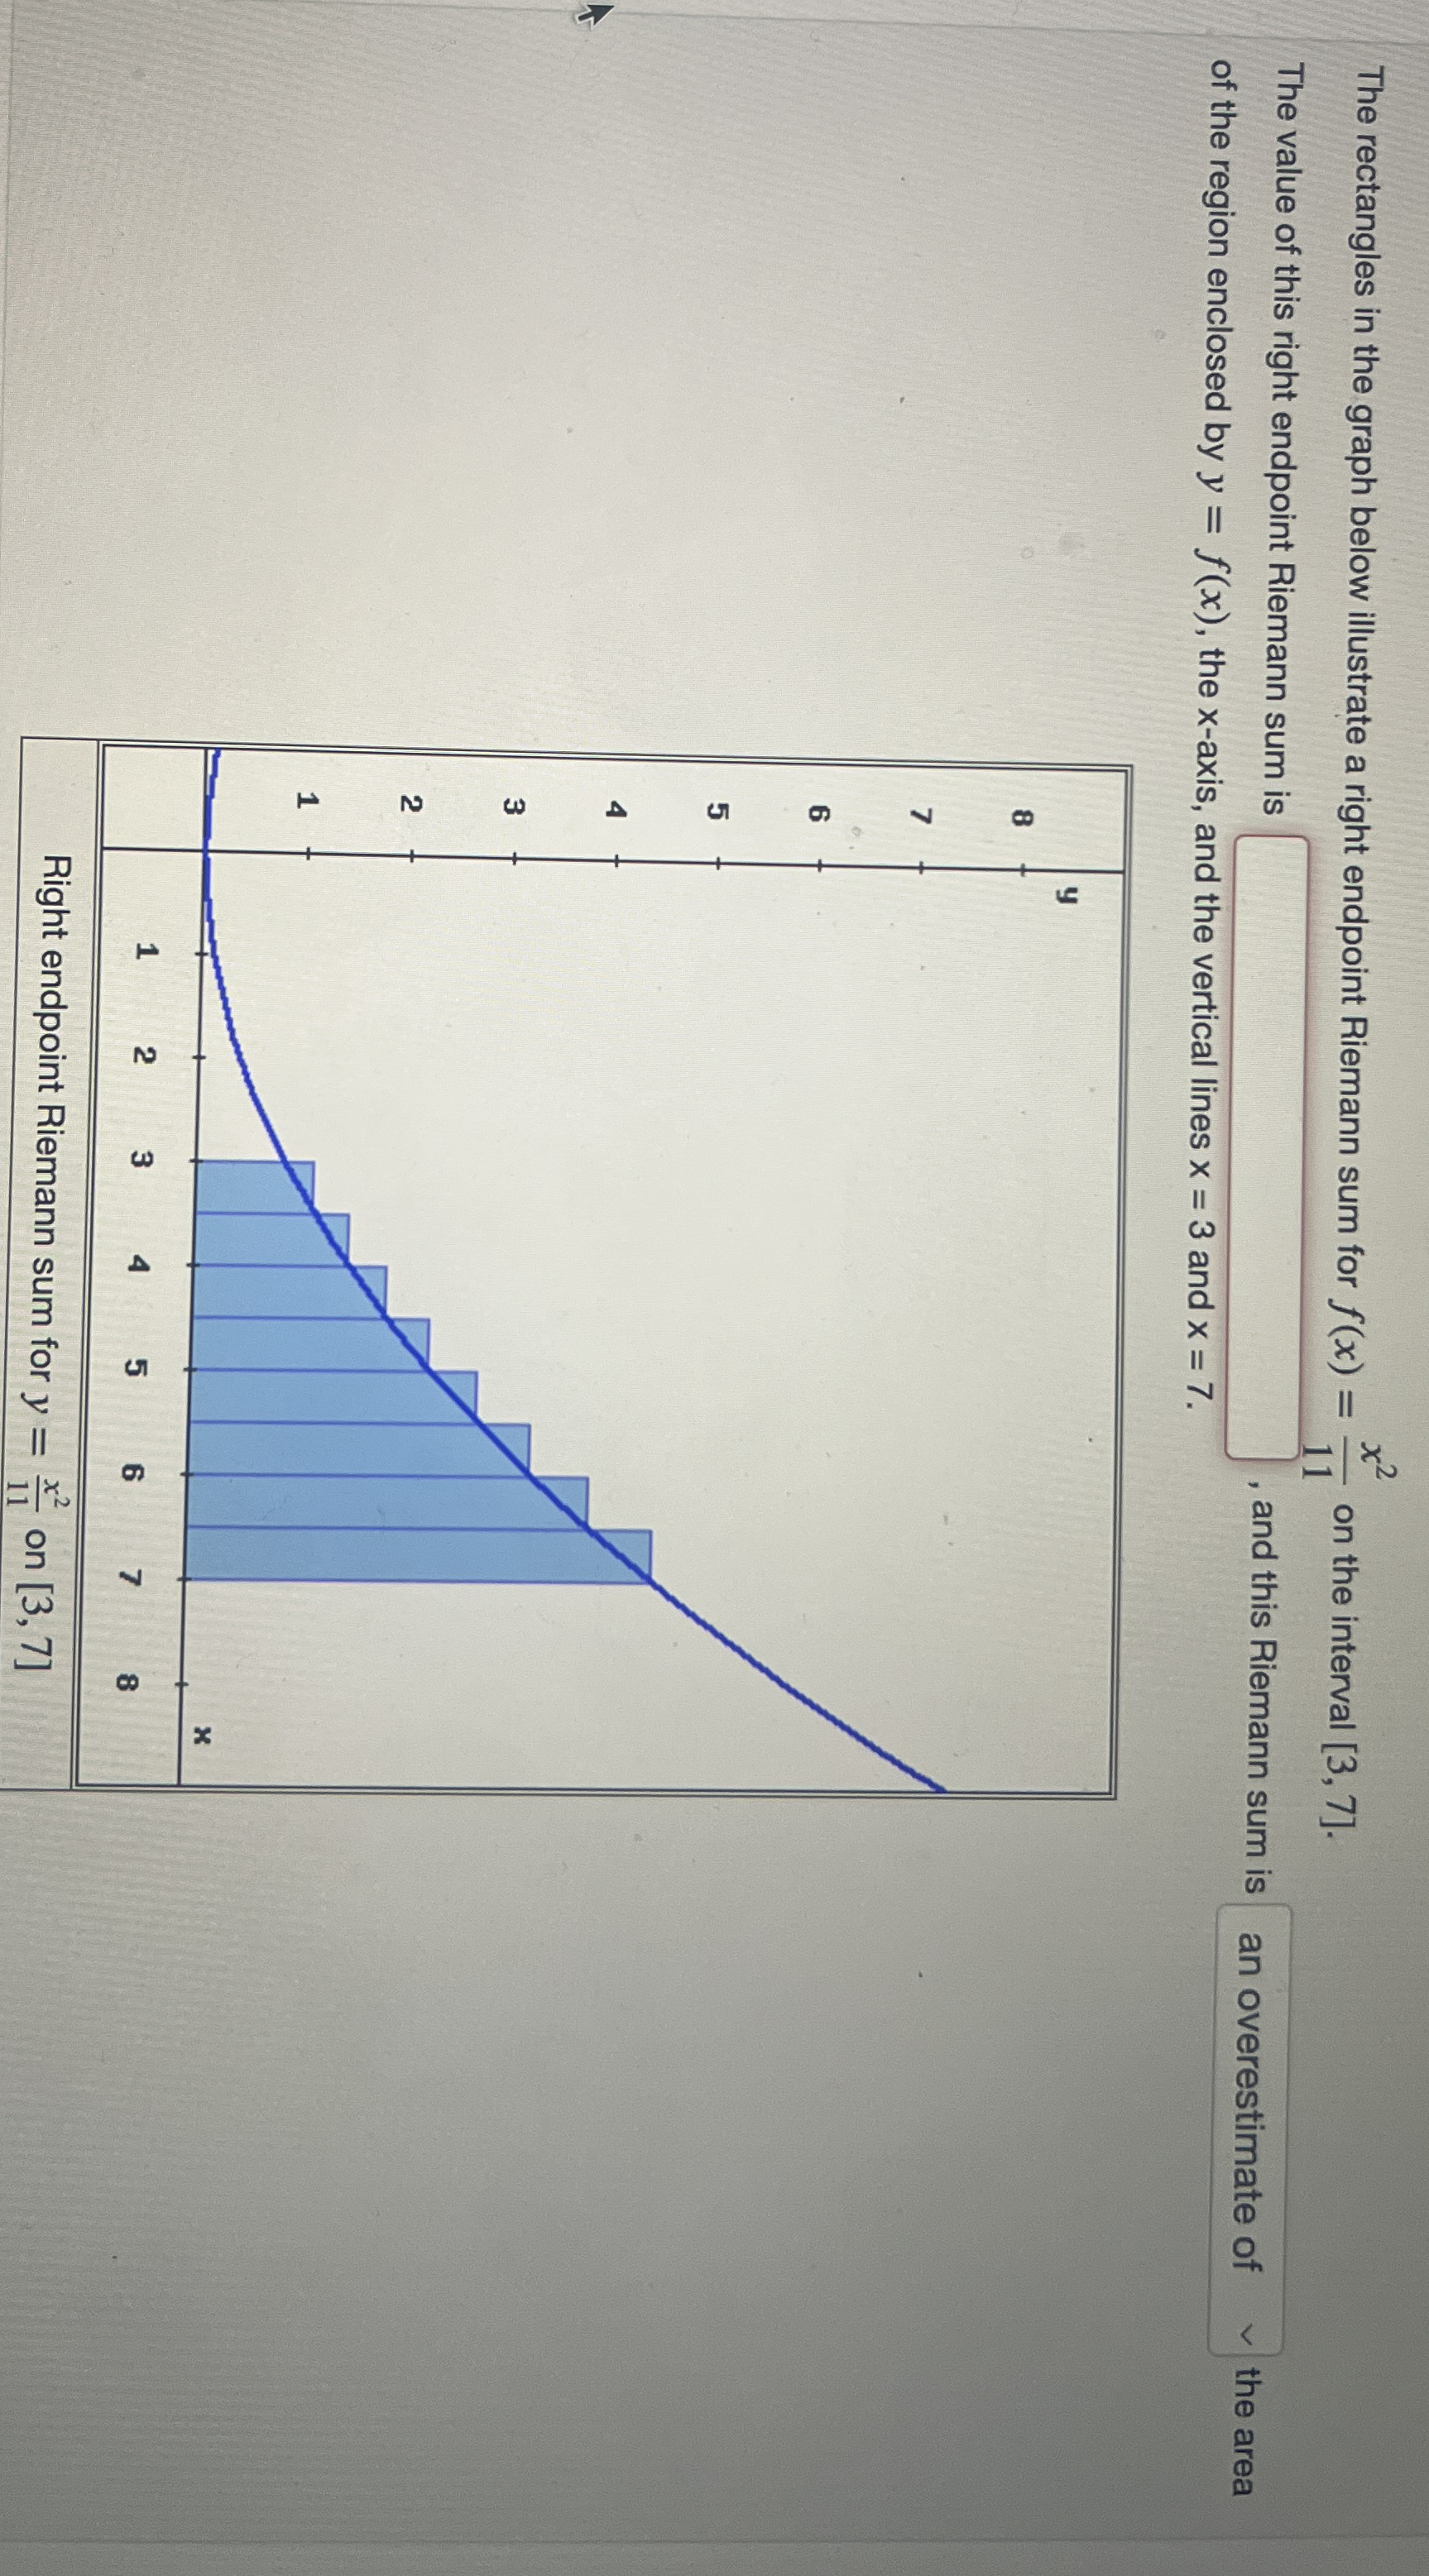
The rectangles in the graph below illustrate a right endpoint Riemann sum for on the interval
The value of this right endpoint Riemann sum is and this Riemann sum is the area of the region enclosed by the x axis, and the vertical lines and
Step by Step Solution
There are 3 Steps involved in it
1 Expert Approved Answer
Step: 1 Unlock

Question Has Been Solved by an Expert!
Get step-by-step solutions from verified subject matter experts
Step: 2 Unlock
Step: 3 Unlock