

Question: The scatter plot shows the average monthly temperature, x, and the monthly heating cost of a family, y, for 24 different months. Monthly heating cost
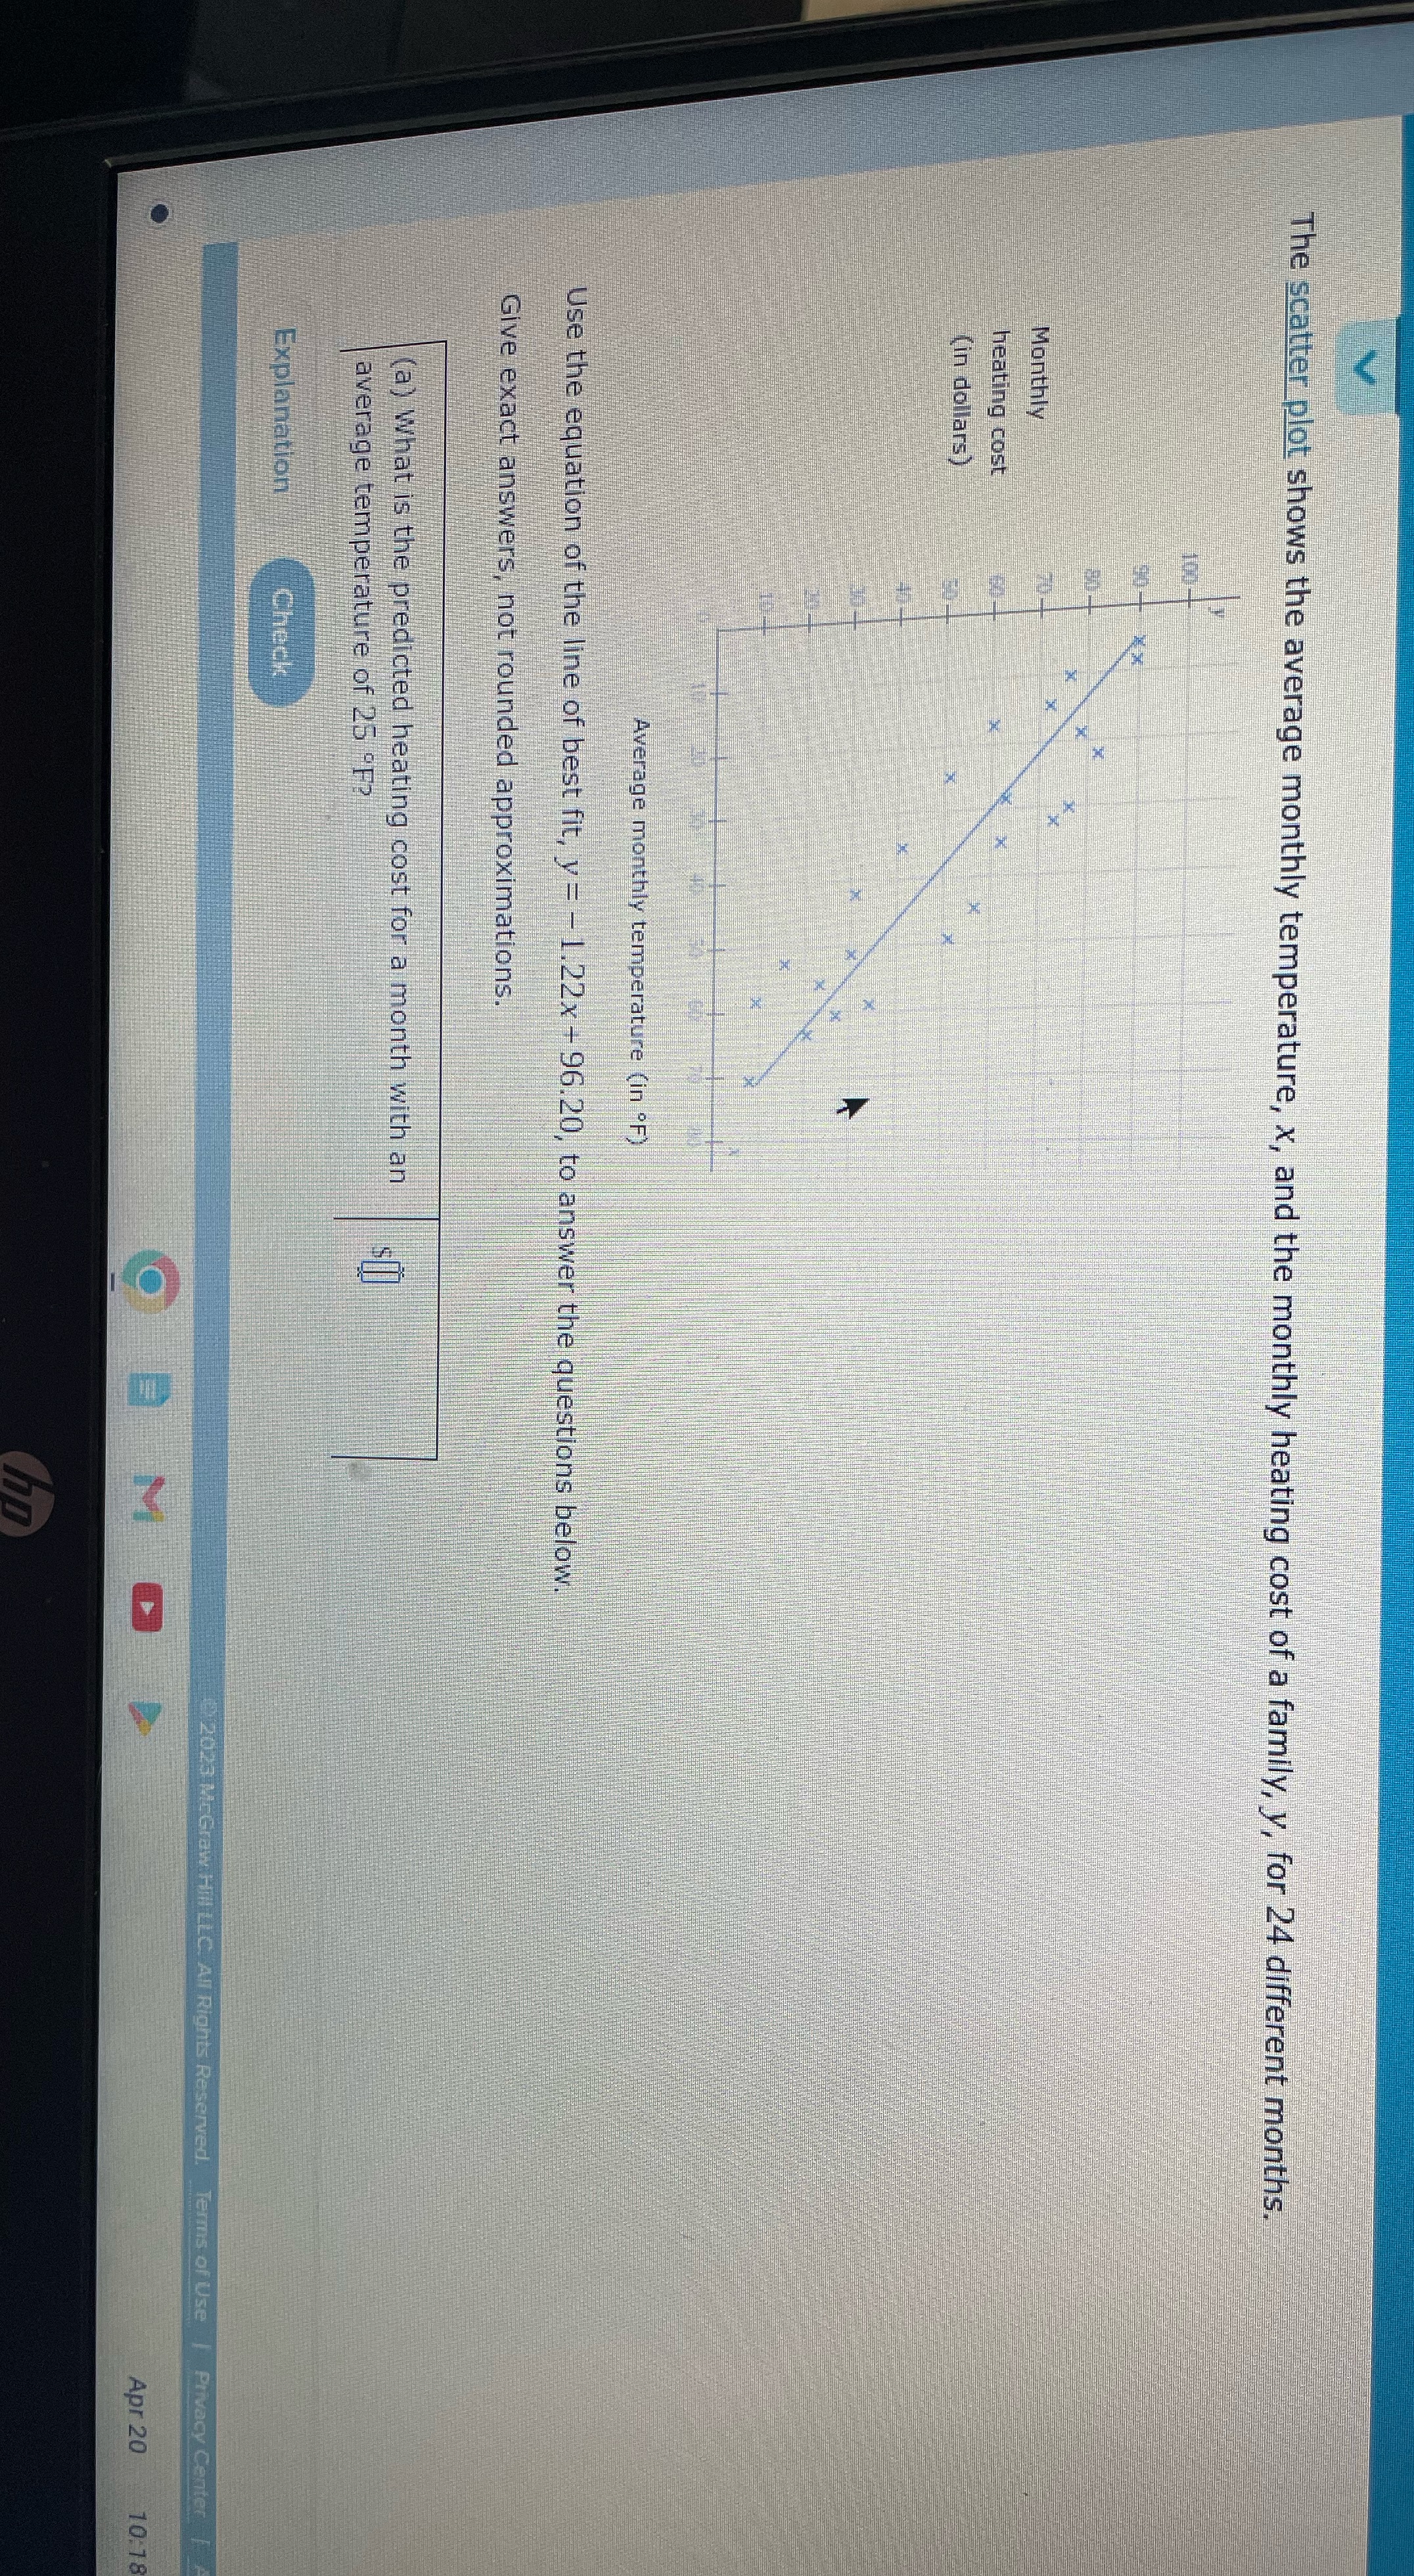
The scatter plot shows the average monthly temperature, x, and the monthly heating cost of a family, y, for 24 different months. Monthly heating cost (in dollars) Average monthly temperature (in OF) Use the equation of the line of best fit, y = - 1.22x -96.20, to answer the questions below. Give exact answers, not rounded approximations. (a) What is the predicted heating cost for a month with an average temperature of 25 -F? Explanation Check 2023 MrGraw. Hill LLC. Al Rights Reserved. Terms of Use | Privacy Center MO Apr 20 10:18
Step by Step Solution
There are 3 Steps involved in it
1 Expert Approved Answer
Step: 1 Unlock

Question Has Been Solved by an Expert!
Get step-by-step solutions from verified subject matter experts
Step: 2 Unlock
Step: 3 Unlock