

Question: thisnis my matlab code so far to plot my ecg data. how can i plot a zoomed in version so only 10 ECB beats show
thisnis my matlab code so far to plot my ecg data. how can i plot a zoomed in version so only 10 ECB beats show on the new plot? Please show code for this step. 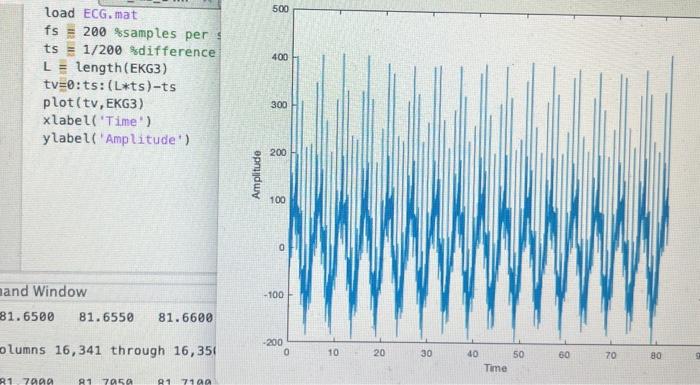
load ECG.mat fs =200 ssamples per ts =1/200 sdifference L= length(EKG3) tv=0:ts: (L*ts) -ts plot(tv, EKG3) xlabel('Time') y label('Amplitude')
Step by Step Solution
There are 3 Steps involved in it
1 Expert Approved Answer
Step: 1 Unlock

Question Has Been Solved by an Expert!
Get step-by-step solutions from verified subject matter experts
Step: 2 Unlock
Step: 3 Unlock