

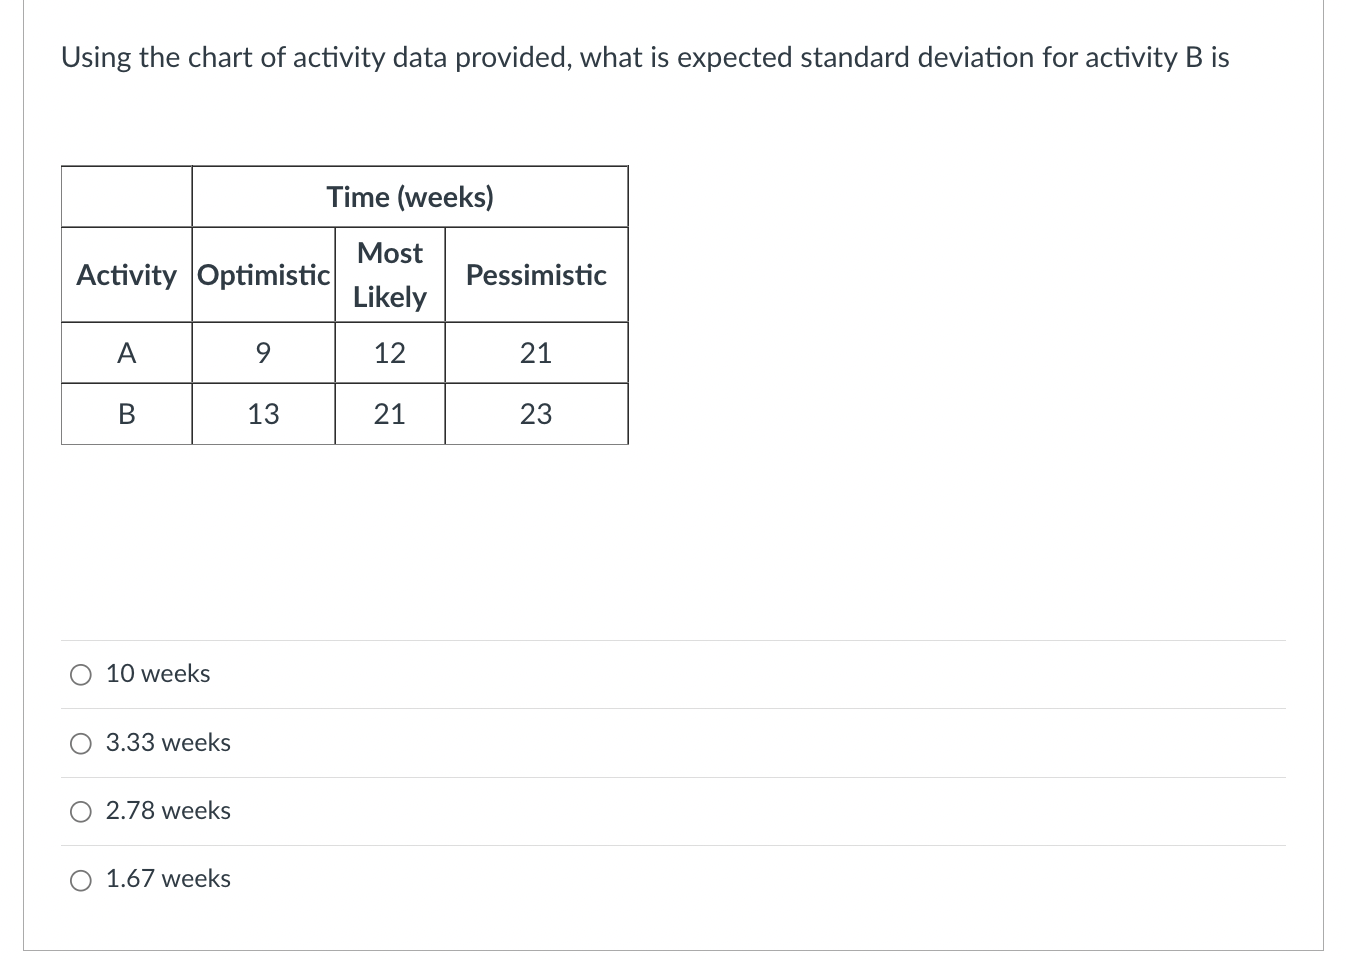
Question: Using the chart of activity data provided, what is expected standard deviation for activity B is 10 weeks 3.33 weeks 2.78 weeks 1.67 weeks
Step by Step Solution
There are 3 Steps involved in it
1 Expert Approved Answer
Step: 1 Unlock

Question Has Been Solved by an Expert!
Get step-by-step solutions from verified subject matter experts
Step: 2 Unlock
Step: 3 Unlock