

Question: Using the orange curve (square symbols), plot the present value of each of the expected future dividends for years 10, 20, and 50. The resulting
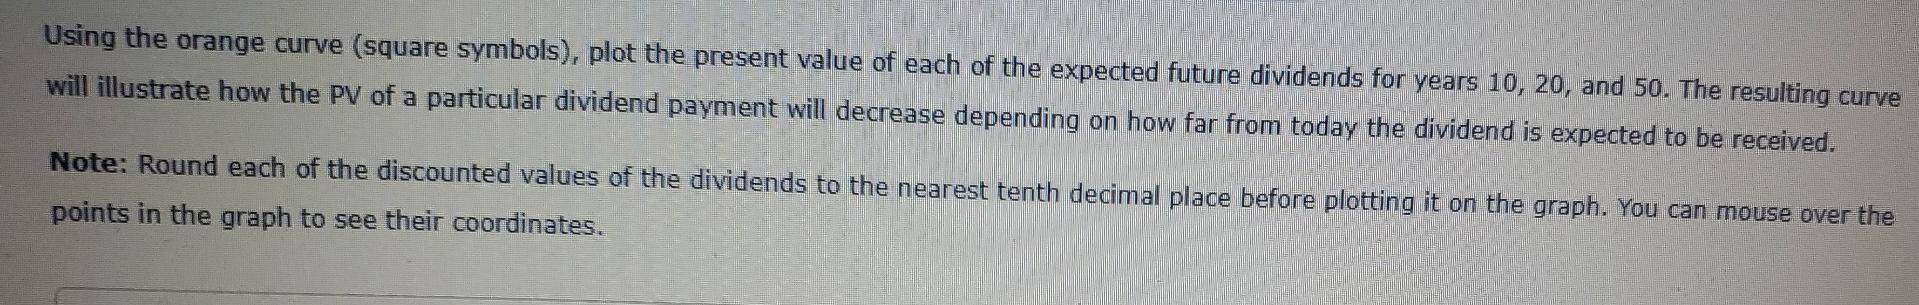
Using the orange curve (square symbols), plot the present value of each of the expected future dividends for years 10, 20, and 50. The resulting curve will illustrate how the PV of a particular dividend payment will decrease depending on how far from today the dividend is expected to be received. Note: Round each of the discounted values of the dividends to the nearest tenth decimal place before plotting it on the graph. You can mouse over the points in the graph to see their coordinates. ? 5.00 Discounted Dividends O FV of Dividends 0.00 DIVIDENDS (5) 2.00 PV of Dividends 0 10 20 40 YEARS Using the orange curve (square symbols), plot the present value of each of the expected future dividends for years 10, 20, and 50. The resulting curve will illustrate how the PV of a particular dividend payment will decrease depending on how far from today the dividend is expected to be received. Note: Round each of the discounted values of the dividends to the nearest tenth decimal place before plotting it on the graph. You can mouse over the points in the graph to see their coordinates. ? 5.00 Discounted Dividends O FV of Dividends 0.00 DIVIDENDS (5) 2.00 PV of Dividends 0 10 20 40 YEARS
Step by Step Solution
There are 3 Steps involved in it

Get step-by-step solutions from verified subject matter experts