

Question: Using the red curve (cross symbols), plot the present value of each of the expected future dividends for years 10, 20, and 50. The resulting
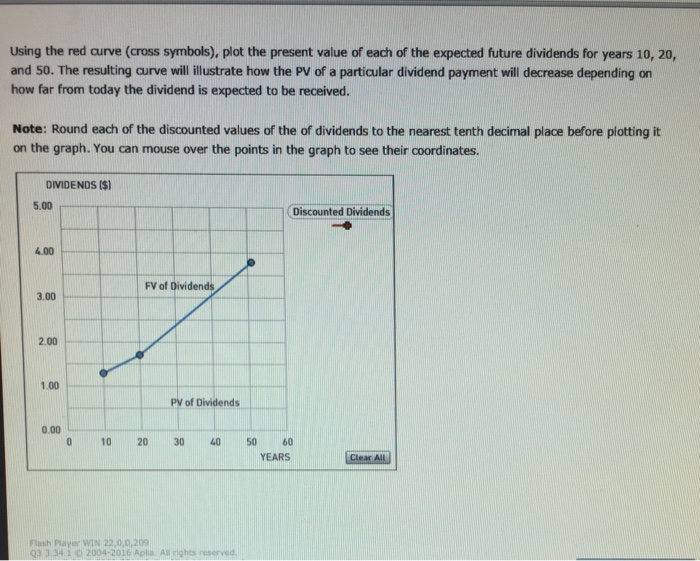
Using the red curve (cross symbols), plot the present value of each of the expected future dividends for years 10, 20, and 50. The resulting curve will illustrate how the PV of a particular dividend payment will decrease depending on how far from today the dividend is expected to be received
Step by Step Solution
There are 3 Steps involved in it
1 Expert Approved Answer
Step: 1 Unlock

Question Has Been Solved by an Expert!
Get step-by-step solutions from verified subject matter experts
Step: 2 Unlock
Step: 3 Unlock