

Question: Using the orange curve (square symbols), plot the present value of each of the expected future dividends for years 10, 20, and 50 . The
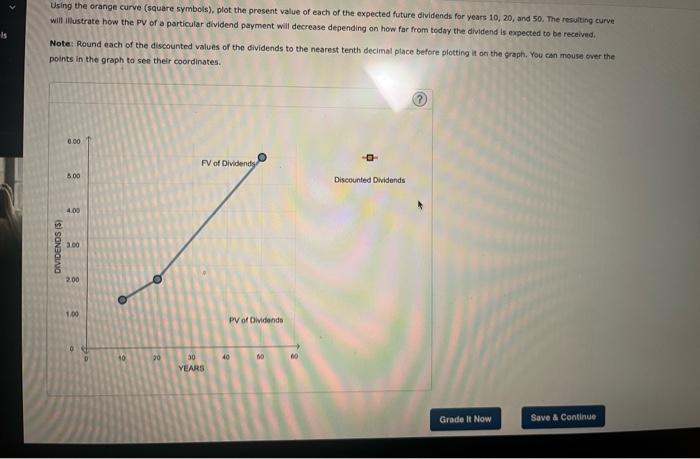
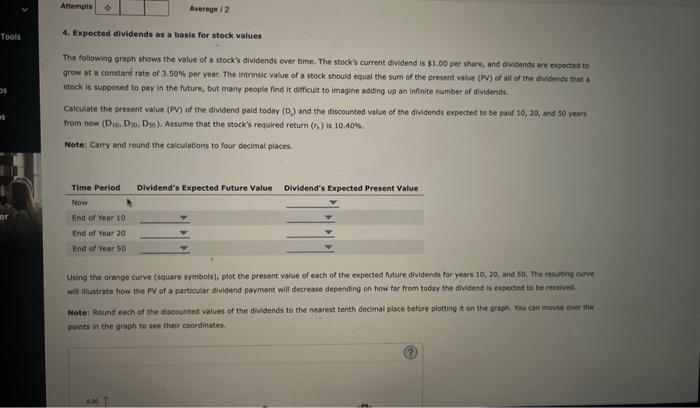
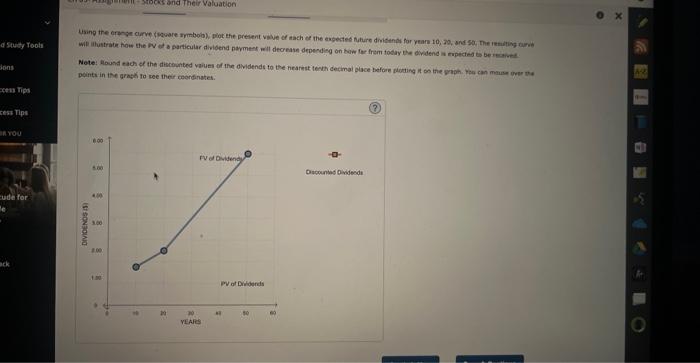
Using the orange curve (square symbols), plot the present value of each of the expected future dividends for years 10, 20, and 50 . The resulting curve will Illustrate how the PV of a particular dividend paryment will decrease depending on how far from today the dividend is expected to be received. Note: Round each of the discounted values of the dividends to the nearest tenth decimal place before plotting it on the graph. You can mouse orer the points in the graph to see their coordinates. 4. Expected dividends as a basis for stock values The foilowing graph shows the value of a stock's dividends over time. The stock's current dividend is $1, oo per share, and dividends are cxpected to grow at a conttank rate of 3.50% per year. The intrinsic value of a stock should equal the sum of the present valoe (pel) of alr of the hividends fhat a stock is supposed to pay in the future, but many people find it dificult to imagine adding up an infinite number of dividendi. Ealculate the present value (pV) of the dividend pald today (Dj) and the discounted value of the dividends expected to be paid 10 , 20 , and so yearl from now (D10,D30,,D30). Assume that the stock's required return (ri) is 10,40% Noter Carry and round the calculabions to four decimal places. Using the arange curve (square symbols). plot the present value of each of the expected future dividends for years so, 20 , and so. The resuling eurve Will illustate how the PN of a particular dividend pmyment will decrease depending on how far from today the dividend is expectied tm be recteweif. Wotet Round each of the discousted values of the dividends to the nearest tenth decimat place before plotting it on the griph. You can mocist uase ithe palnts in the graph to ste their coordirstes. pginti in the gragel fo see their coordinates
Step by Step Solution
There are 3 Steps involved in it

Get step-by-step solutions from verified subject matter experts