

Question: Old MathJax webview Using the grey curve (star symbols), plot the present value of each of the expected future dividends for years 10, 20, and
Old MathJax webview

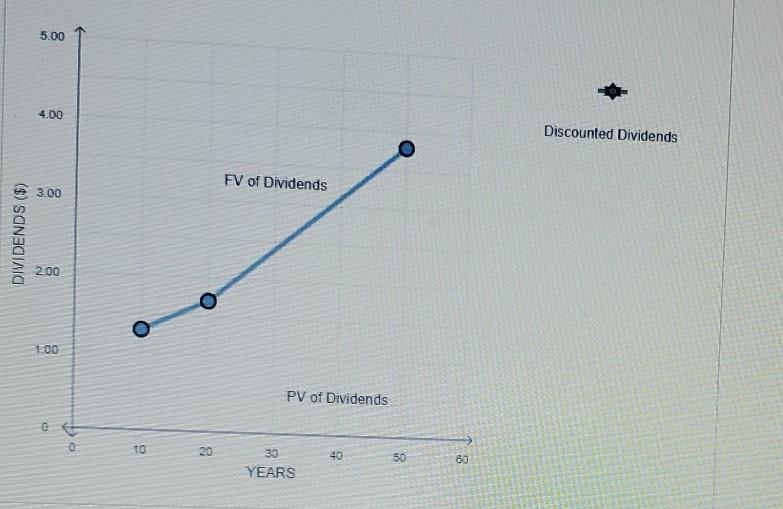
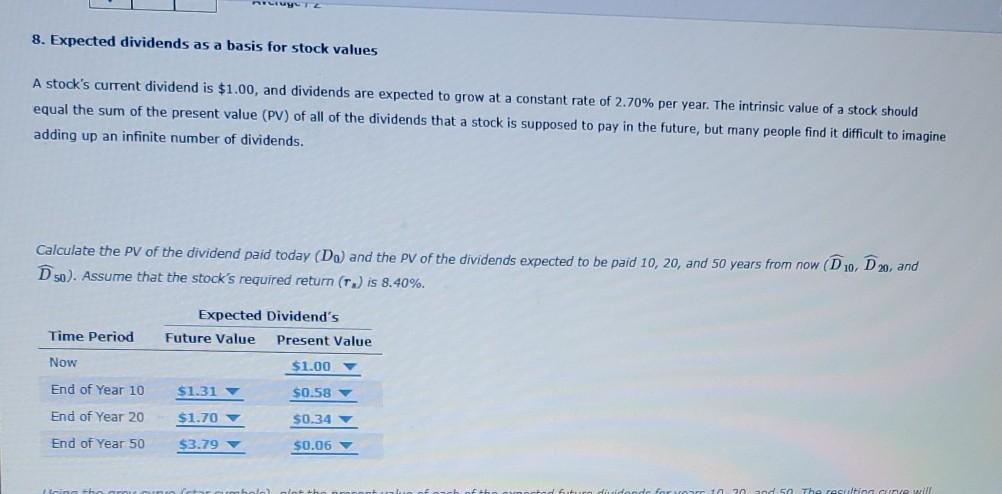
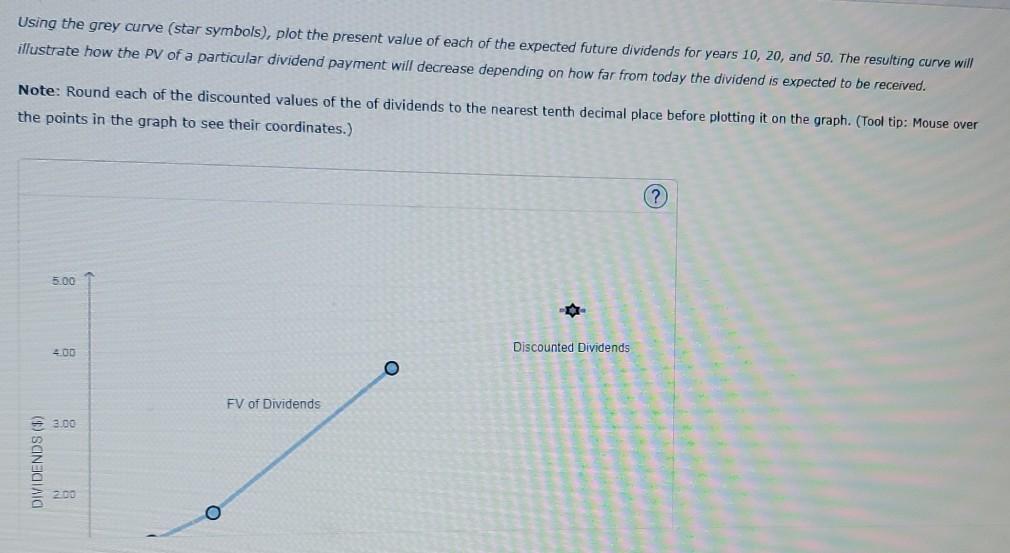
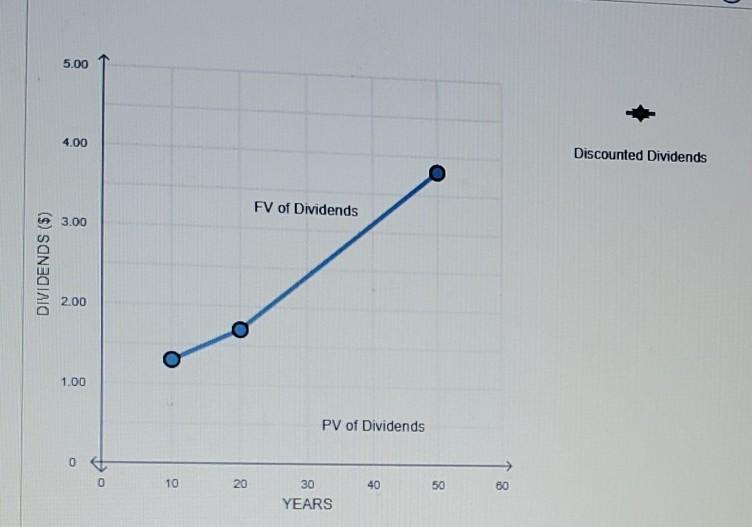
Using the grey curve (star symbols), plot the present value of each of the expected future dividends for years 10, 20, and 50. The resulting curve will illustrate how the PV of a particular dividend payment will decrease depending on how far from today the dividend is expected to be received. Note: Round each of the discounted values of the of dividends to the nearest tenth decimal place before plotting it on the graph. (Tooltip: Mouse over the points in the graph to see their coordinates.) 5.00 4.00 Discounted Dividends FV of Dividends 3.00 DIVIDENDS ($) 200 1.00 PV of Dividends C TO 20 40 50 30 YEARS 80 8. Expected dividends as a basis for stock values A stock's current dividend is $1.00, and dividends are expected to grow at a constant rate of 2.70% per year. The intrinsic value of a stock should equal the sum of the present value (PV) of all of the dividends that a stock is supposed to pay in the future, but many people find it difficult to imagine adding up an infinite number of dividends. Calculate the PV of the dividend paid today (Do) and the PV of the dividends expected to be paid 10, 20, and 50 years from now (D 10D20, and D so). Assume that the stock's required return (T) is 8.40%. Expected Dividend's Future Value Present Value Time Period Now $1.00 End of Year 10 $1.31 $0.58 End of Year 20 $1.70 $0.34 End of Year 50 $3.79 $0.06 Using the grey curve (star symbols), plot the present value of each of the expected future dividends for years 10, 20, and 50. The resulting curve will illustrate how the PV of a particular dividend payment will decrease depending on how far from today the dividend is expected to be received. Note: Round each of the discounted values of the of dividends to the nearest tenth decimal place before plotting it on the graph. (Tool tip: Mouse over the points in the graph to see their coordinates.) ? 5.00 Discounted Dividends FV of Dividends 3.00 DIVIDENDS ($) O 5.00 4.00 Discounted Dividends FV of Dividends 3.00 DIVIDENDS ($) 2.00 1.00 PV of Dividends 0 0 10 20 30 40 50 80 YEARS
Step by Step Solution
There are 3 Steps involved in it

Get step-by-step solutions from verified subject matter experts