

Question: Using the orange curve (square symbols), plot the present value of each of the expected future dividends for years 10, 20, and 50. The resulting
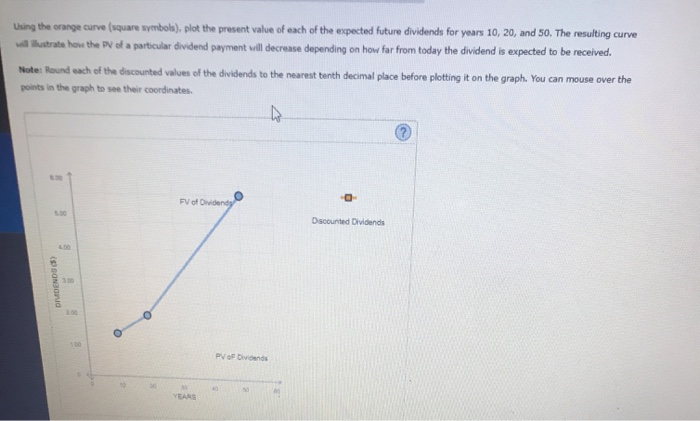
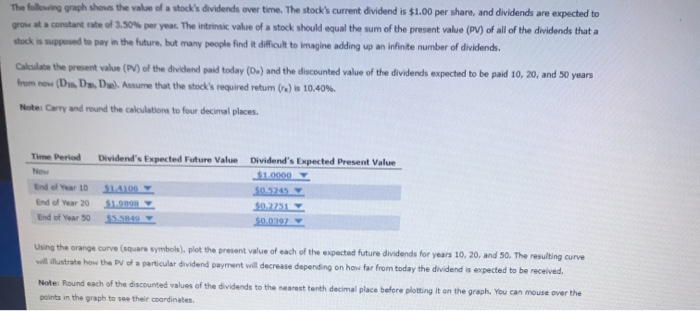
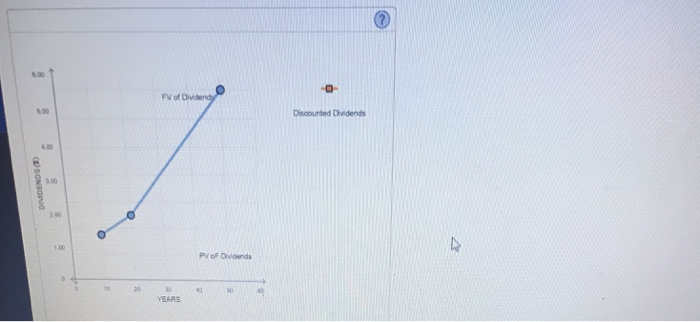
Using the orange curve (square symbols), plot the present value of each of the expected future dividends for years 10, 20, and 50. The resulting curve strate how the PV of a particular dividend payment will decrease depending on how far from today the dividend is expected to be received. Note: Round each of the discounted values of the dividends to the nearest tenth decimal place before plotting it on the graph. You can mouse over the points in the graph to see the coordinates PV of Dividend Dscounted Dividends DIVIDENDO Pets The following graph shows the value of a stock dividends over time. The stock's current dividend is $1.00 per share, and dividends are expected to grow at a constant rate of 3.50 per year. The intrinsic value of a stock should equal the sum of the present value (PV) of all of the dividends that a ock is supposed to pay in the future, but many people find it difficult to imagine adding up an infinite number of dividends. Calculate the present value (PV) of the dividend paid today (D) and the discounted value of the dividends expected to be paid 10, 20, and 50 years from new ( D D D ). Assume that the stock's required retum () is 10.40%. Note: Carry and round the calculations to four decimal places The Period Dividend's Expected Future Value Dividend's Expected Present Value $1.0000 doar 10 14100 End of Year 2031.9898 End of Year 50 $5.5849 50.2751 50.0892 Using the orange curve (s are symbol plot the present value of each of the expected future dividends for years 10. 20. and 50. The resulting curve strate how the of particular dividend payment will decrease depending on how tar from today the dividend is expected to be received. Note: Round each of the discounted values of the dividends to the nearest tenth decimal place before plotting it on the graph. You can mouse over the points in the graph to see their coordinates FV of Dividendy Discounted Dividends DIVIDENDS3 PV of Dividends YEARS
Step by Step Solution
There are 3 Steps involved in it

Get step-by-step solutions from verified subject matter experts