

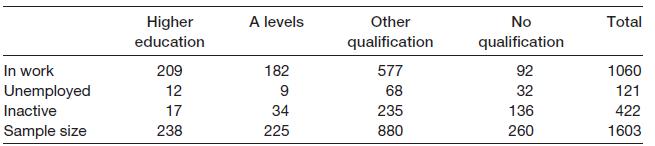
The following data show the education and employment status of women aged 2029 (from the 1991 General
Question:
The following data show the education and employment status of women aged 20–29 (from the 1991 General Household Survey):
(a) Draw a bar chart of the numbers in work in each education category. Can this be easily compared with the similar diagram for 2003 (Figure 1.1)?
(b) Draw a stacked bar chart using all the employment states, similar to Figure 1.3. Comment upon any similarities and differences from the diagram in the text.
(c) Convert the table into (column) percentages and produce a stacked bar chart similar to Figure 1.4. Comment upon any similarities and differences.
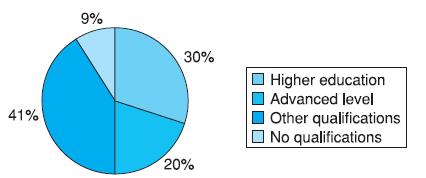
(d) Draw a pie chart showing the distribution of educational qualifications of those in work and compare it to Figure 1.5 in the text.
Figure 1.1
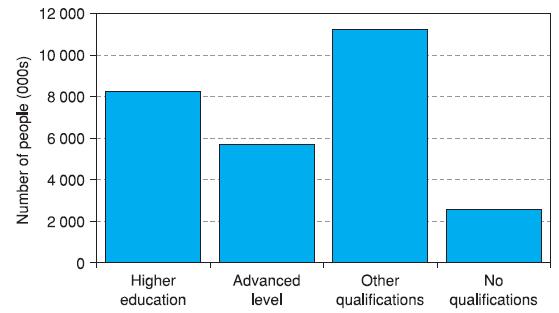
Figure 1.3
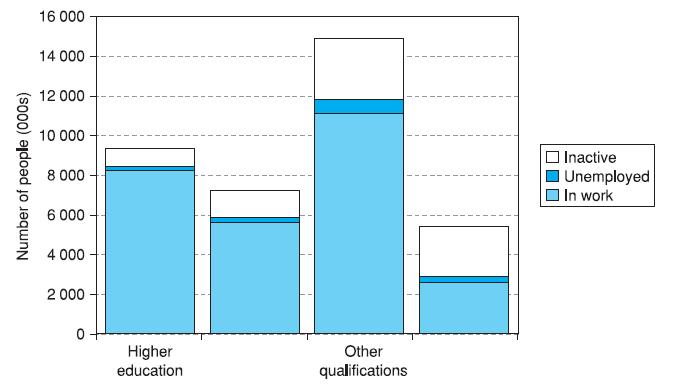
Figure 1.4
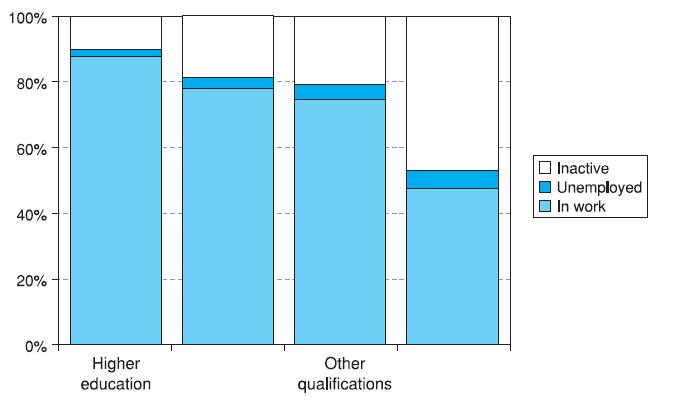
Figure 1.5
Step by Step Answer:

This question has not been answered yet.
You can Ask your question!

Statistics For Economics Accounting And Business Studies
ISBN: 978027368308
4th Edition
Authors: Michael Barrow
