

Question: Use a statistical spreadsheet or a graphing calculator with advanced statistical features to draw a scatter diagram of the data in Table 1. Then determine
Use a statistical spreadsheet or a graphing calculator with advanced statistical features to draw a scatter diagram of the data in Table 1. Then determine the linear correlation between club-head speed and distance.
Approach We will use Excel to draw the scatter diagram and obtain the linear correlation coefficient. The steps for drawing scatter diagrams and obtaining the linear correlation coefficient using the TI-83/84 Plus graphing calculators, Minitab, Excel, and StatCrunch are given in the Technology Step-by-Step.
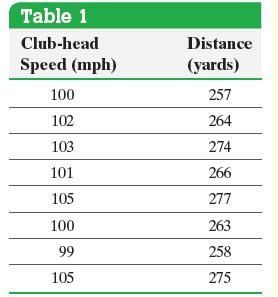
Table 1 Club-head Distance Speed (mph) (yards) 100 257 102 264 103 274 101 266 105 277 100 263 99 258 105 275
Step by Step Solution
3.55 Rating (148 Votes )
There are 3 Steps involved in it
Figure 7 a shows the scatter diagram and Figure 7 b sho... View full answer

Get step-by-step solutions from verified subject matter experts