New Semester
Started
Get
50% OFF
Study Help!
--h --m --s
Claim Now
Question Answers
Textbooks
Find textbooks, questions and answers
Oops, something went wrong!
Change your search query and then try again
S
Books
FREE
Study Help
Expert Questions
Accounting
General Management
Mathematics
Finance
Organizational Behaviour
Law
Physics
Operating System
Management Leadership
Sociology
Programming
Marketing
Database
Computer Network
Economics
Textbooks Solutions
Accounting
Managerial Accounting
Management Leadership
Cost Accounting
Statistics
Business Law
Corporate Finance
Finance
Economics
Auditing
Tutors
Online Tutors
Find a Tutor
Hire a Tutor
Become a Tutor
AI Tutor
AI Study Planner
NEW
Sell Books
Search
Search
Sign In
Register
study help
mathematics
statistics
Essentials Of Business Statistics 5th Edition Bruce Bowerman, Richard Connell, Emily Murphree, Burdeane Or - Solutions
Refer to the Reading in a Foreign Language (Apr. 2004) experiment to improve the Japanese reading comprehension levels of University of Hawaii students, presented in Exercise. Recall that 14 students participated in a 10-week extensive reading program in a second-semester Japanese course. The
Two University of Georgia researchers studied the effect of social reinforcement on the duration of exercise in adolescents with moderate mental retardation (Clinical Kinesiology, Spring 1995). Eleven adolescents with IQs ranging from 32 to 61 were divided into two groups. All participated in a
Refer to the Journal of Geography's published rankings of regional atlas theme topics, presented in Exercise 14.107. In addition to high school teachers and university geography alumni, university geography students and representatives of the general public ranked the 12 thematic topics. The
Researchers from the United Kingdom and Germany attempted to develop a theoretically grounded measure of organizational Internet use (OIU) and published their results in Internet Research (Vol. 15, 2005). Using data collected from a sample of 77 Web sites, they investigated the link between OIU
In a comparison of the visual acuity of deaf and hearing children, eye movement rates are taken on 10 deaf and 10 hearing children. The data are shown in the accompanying table and saved in the EYEMOVE file. A clinical psychologist believes that deaf children have greater visual acuity than hearing
Hematology tests on workers. The accompanying table (saved in the LYMPHO file) lists the lymphocyte count results from hematology tests administered to a sample of 50 West Indian or African workers. Test (at α = .05) the hypothesis that the median lymphocyte count of all West Indian
Twelve sets of identical twins are given psychological tests to determine whether the firstborn of the twins tends to be more aggressive than the secondborn. The test scores are shown in the accompanying table, where the higher score indicates greater aggressiveness. Do the data (saved in the
An experiment was designed to study whether eye pupil size is related to a person's attempt at deception. Eight students were asked to respond verbally to a series of questions. Before the questioning began, the size of one of each student's pupils was noted and the students were instructed to
Many water treatment facilities supplement the natural fluoride concentration with hydrofluosilicic acid in order to reach a target concentration of fluoride in drinking water. Certain levels are thought to enhance dental health, but very high concentrations can be dangerous. Suppose that one such
Two expert wine tasters were asked to rank six brands of wine. Their rankings are shown in the following table and saved in the WINETASTE file. Do the data indicate a positive correlation in the rankings of the two experts? Test, using α = .10.
Self-managed work teams and family life. Refer to the Quality Management Journal (Summer 1995) study of self-managed work teams (SMWTs), presented in Exercise. Recall that the researchers investigated the connection between SMWT work char acteristics and workers' perceptions of positive spillover
A bank manager has developed a new system to reduce the time customers spend waiting to be served by tellers during peak business hours. Typical waiting times during peak business hours under the current system are roughly 9 to 10 minutes. The bank manager hopes that the new system will lower
Discuss the difference between a ratio variable and an interval variable.
Classify each of the following qualitative variables as ordinal or nominative. Explain your answers. Qualitative Variable Categories Statistics course letter grade.... A B C D F Door choice on Let’s Make A Deal.. Door # 1 Door # 2 Door # 3 Television show
Classify each of the following qualitative variables as ordinal or nominative. Explain your answers. Qualitative Variable Categories Personal computer operating system.. Windows XP Windows Vista Windows 7 Windows 8 Motion picture classifications... G PG PG- 13 R NC-
According to the website of the American Association for Justice,11 Stella Liebeck of Albuquerque, New Mexico, was severely burned by McDonald’s coffee in February 1992. Liebeck, who re-ceived third- degree burns over 6 percent of her body, was awarded $ 160,000 in compensatory damages and $
Below we list several variables. Which of these variables are quantitative and which are qualitative? Explain. a. The dollar amount on an accounts receivable invoice. b. The net profit for a company in 2013. c. The stock exchange on which a company’s stock is traded. d. The national debt of
(1) Discuss the difference between cross- sectional data and time series data. (2) If we record the total number of cars sold in 2012 by each of 10 car salespeople, are the data cross- sectional or time series data? (3) If we record the total number of cars sold by a particular car salesperson in
The number of Bismark X- 12 electronic calculators sold at Smith’s Department Stores over the past 24 months have been: 197, 211, 203, 247, 239, 269, 308, 262, 258, 256, 261, 288, 296, 276, 305, 308, 356, 393, 363, 386, 443, 308, 358, and 384. Make a time series plot of these data. That is, plot
Figure 2.5 gives a percentage pie chart of new vehicle market shares in the U. S. for 2010 as given by GoodCarBadCar.net. Use this pie chart and your results from Exercise 2.9 to write an analysis explaining how new vehicle market shares in the United States have changed from 2005 to 2010.
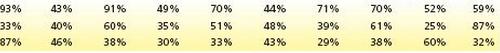
On January 11, 2005, the Gallup Organization released the results of a poll investigating how many Americans have private health insurance. The results showed that among Americans making less than $ 30,000 per year, 33% had private insurance, 50% were covered by Medicare/ Medicaid, and 17% had no
In an article in Quality Progress, Barbara A. Cleary reports on improvements made in a software supplier’s responses to customer calls. In this article, the author states: In an effort to improve its response time for these important customer- support calls, an inbound telephone inquiry team was
Explain: a. Why we construct a frequency distribution and a histogram for a data set. b. The difference between a frequency histogram and a frequency polygon. c. The difference between a frequency polygon and a frequency ogive.
When constructing a frequency distribution and histogram, explain how to find: a. The frequency for a class. b. The relative frequency for a class. c. The percent frequency for a class.
Explain what each of the following distribution shapes looks like. Then draw a picture that illustrates each shape.a. Symmetrical and mound shapedb. Double peakedc. Skewed to the rightd. Skewed to the left
Consider the data in the page margin.a. Find the number of classes needed to construct a histogram.b. Find the class length.c. Define nonoverlapping classes for a frequency distribution.d. Tally the number of values in each class and develop a frequency distribution.e. Draw a frequency histogram
Consider the frequency distribution of exam scores in the page margin.a. Develop a relative frequency distribution and a percent frequency distribution.b. Develop a cumulative frequency distribution and a cumulative percent frequency distribution.c. Draw a percent frequency polygon.d. Draw a
a. Find the number of classes that should be used to construct a frequency distribution and histogram for the bottle design ratings.b. If we round up to the nearest whole rating point, show that we should employ a class length equal to 3.c. Define the nonoverlapping classes for a frequency
a. Construct a relative frequency distribution and a percent frequency distribution for the bottle design ratings.b. Construct a cumulative frequency distribution and a cumulative percent frequency distribution.c. Draw a percent frequency ogive for the bottle design ratings.
Table 2.11 gives the 25 most powerful celebrities and their annual pay as ranked by the editors of Forbes magazine and as listed on the Forbes.com website on June 14, 2011. PowerCeleba. Develop a frequency distribution for the celebrity pay data and draw a frequency histogram.b. Develop a
Recall that Table 1.7 presents the satisfaction ratings for the XYZ- Box video game system that have been given by 65 randomly selected purchasers. Figure 2.15 on the next page gives the Excel output of a histogram of these satisfaction ratings.a. Describe where the satisfaction ratings seem to be
Recall that Table 1.8 presents the waiting times for teller service during peak business hours of 100 randomly selected bank customers. Figure 2.16 on the next page gives the MINITAB output of a histogram of these waiting times that has been constructed using automatic classes.a. Describe where the
Recall that Table 1.9 (page 14) presents the breaking strengths of 40 trash bags selected during a 40- hour pilot production run. Figure 2.17 gives a percent frequency histogram of these breaking strengths.a. Describe where the breaking strengths seem to be concentrated.b. Describe and interpret
Table 2.12 gives the franchise value and 2011 revenues for each of the 30 teams in Major League Baseball as reported by Forbes magazine and as listed on the Forbes.com website on June 14, 2011. MLBTeamsa. Develop a frequency distribution and a frequency histogram for the 30 team values. Then
Table 2.13 gives America€™s top 40 best small companies of 2010 as rated on the Forbes.com website on June 14, 2011. SmallCompa. Develop a frequency distribution and a frequency histogram for the sales values. Describe the distribution of these sales values.b. Develop a percent frequency
To construct a histogram for these data, we select one of the classes as a base. It is often convenient to choose the shortest class as the base (although it is not necessary to do so). Using this choice, the 0 to $ 10K class is the base. This means that we will draw a rectangle over the 0 to $ 10K
To complete the histogram from Exercise 2.26, we place a star (*) to the right of $ 500K on the scale of measurements and note “37” next to the * to indicate 37 companies saved more than $ 500K. Complete the histogram by doing this.
The following data consist of the number of students who were absent in a professor€™s statistics class each day during the last month.Construct a dot plot of these data, and then describe the distribution of absences.
The following are the revenue growth rates for 30 fast- growing companies.Develop a dot plot for these data and describe the distribution of revenue growth rates.
The yearly home run totals for Babe Ruth during his career as a New York Yankee are as follows ( the totals are arranged in increasing order): 22, 25, 34, 35, 41, 41, 46, 46, 46, 47, 49, 54, 54, 59, 60. Construct a dot plot for these data and then describe the distribution of home run totals.
The following data consist of the revenue growth rates ( in percent) for a group of 20 firms. Construct a stem- and- leaf display for these data.
The following data consist of the profit margins (in percent) for a group of 20 firms. Construct a stem- and- leaf display for these data.
The following data consist of the sales figures ( in millions of dollars) for a group of 20 firms. Construct a stem- and- leaf display for these data. Use a leaf unit equal to 100.
A multiple choice question on an exam has four possible responses—(a), (b), (c), and (d). When 250 students take the exam, 100 give response (a), 25 give response (b), 75 give response (c), and 50 give response (d).a. Write out the frequency distribution, relative frequency distribution, and
Figure 2.22 gives a stem- and- leaf display of the sample of 40 breaking strengths in the trash bag case. a. Use the stem- and- leaf display to describe the distribution of breaking strengths. b. Write out the 10 smallest breaking strengths as they would be expressed in the original data.
Babe Ruth’s record of 60 home runs in a single year was broken by Roger Maris, who hit 61 home runs in 1961. The yearly home run totals for Ruth in his career as a New York Yankee are ( arranged in increasing order) 22, 25, 34, 35, 41, 41, 46, 46, 46, 47, 49, 54, 54, 59, and 60. The yearly home
Table 2.15 reproduces the 100 waiting times for teller service that were originally given in Table 1.8 (page 13).a Construct a stem- and- leaf display of the waiting times.b Describe the distribution of the waiting times.In Table 1.8
Recall that 65 purchasers have participated in a survey and have rated the XYZ- Box video game sys-tem. The composite ratings that have been obtained are as follows:a. Construct a stem- and- leaf display for the 65 composite ratings. Use the implied zeros as the leaf values and the whole numbers
Explain how to compute (1) the row percentages for a contingency table, and (2) the column percentages. What information is provided by the row percentages in a particular row of the table? What information is provided by the column percentages in a particular column of the table?
Construct a contingency table using cola preference (Rola or Koka) as the row variable and Rola- Cola purchase history (Yes or No) as the column variable. Based on the table, answer the following. ColaSurveya. How many shoppers who preferred Rola-Cola in the blind taste test had previously
Construct a contingency table using cola preference (Rola or Koka) as the row variable and sweetness preference (very sweet, sweet, or not so sweet) as the column variable. Based on the table, answer the following: ColaSurveya. How many shoppers who preferred Rola-Cola in the blind taste test said
Construct a contingency table using cola preference (Rola or Koka) as the row variable and the number of 12- packs consumed in a typical month ( categories 0 through 5, 6 through 10, and more than 10) as the column variable. Based on the table, answer the following: ColaSurveya. How many shoppers
Consider constructing a pie chart for the exam question responses in Exercise 2.4. a. How many degrees (out of 360) would be assigned to the “pie slice” for the response (a)? b. How many degrees would be assigned to the “pie slice” for response (b)? c. Construct the pie chart for the
A marketing research firm wishes to study the relationship between wine consumption and whether a person likes to watch professional tennis on television. One hundred randomly selected people are asked whether they drink wine and whether they watch tennis. The following results are obtained:a. What
In a survey of 1,000 randomly selected U. S. citizens aged 21 years or older, 721 believed that the amount of violent television programming had increased over the past 10 years, 454 believed that the overall quality of television programming had gotten worse over the past 10 years, and 362
In a Gallup Lifestyle Poll concerning American tipping attitudes, the Gallup News service (on January 8, 2007) reported results that allow construction of two contingency tables given below. The first table uses row percentages to investigate a possible relationship between recommended tip
Accu Copiers, Inc., sells and services the Accu-500 copying machine. To obtain information about the time it takes to perform routine service, Accu Copiers has collected the data in the page margin for 11 service calls. Here, x denotes the number of copiers serviced and y denotes the number of
Figure 2.27 presents the ratings given by 406 randomly selected individuals of six fast food restaurants on the basis of taste, convenience, familiarity, and price. The data were collected by researchers at The Ohio State University in the early 1990s. Here, 1 is the best rating and 6 the worst. In
Consider the partial relative frequency distribution of consumer preferences for four products— W, X, Y, and Z— that is shown in the page margin. a. Find the relative frequency for product X. b. If 500 consumers were surveyed, give the frequency distribution for these data. c. Construct a
In the article “ How to Display Data Badly” in the May 1984 issue of The American Statistician, Howard Wainer presents a stacked bar chart of the number of public and private elementary schools ( 1929– 1970). This bar chart is given in Figure 2.33 on the previous page. Wainer also gives a
At the end of 2011 Chrysler Motors was trying to decide whether or not to discontinue production of a Jeep model introduced in 2002€” the Jeep Liberty. Although Liberty sales had generally declined since 2007 with the cancellation of one Jeep model and the introduction of three new Jeep models,
Develop a frequency distribution of the overall mechanical quality ratings. Describe the distribution.
Develop a relative frequency distribution of the overall design quality ratings. Describe the distribution.
Construct a percentage bar chart of the overall mechanical quality ratings for each of the following: automobiles of United States origin; automobiles of Pacific Rim origin ( Japan/ Korea); and automobiles of European origin ( Germany/ Great Britain/ Sweden). Compare the three distributions in a
Construct a percentage pie chart of the overall design quality ratings for each of the following: automobiles of United States origin; automobiles of Pacific Rim origin ( Japan/ Korea); and automo-biles of European origin ( Germany/ Great Britain/ Sweden). Compare the three distributions in a
Construct a contingency table of automobile origin versus overall mechanical quality rating. Set up rows corresponding to the United States, the Pacific Rim ( Japan/ Korea), and Europe ( Germany/ Great Britain/ Sweden), and set up columns corresponding to the ratings “ among the best” through
Develop a table of row percentages for the contingency table you set up in Exercise 2.67. Using these row percentages, construct a percentage frequency distribution of overall mechanical quality rating for each of the United States, the Pacific Rim, and Europe. Illustrate these three frequency
Construct a contingency table of automobile origin versus overall design quality rating. Set up rows corresponding to the United States, the Pacific Rim (Japan/ Korea), and Europe (Germany/ Great Britain/ Sweden), and set up columns corresponding to the ratings “among the best” through “the
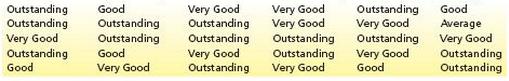
Below we give the overall dining experience ratings (Outstanding, Very Good, Good, Average, or Poor) of 30 randomly selected patrons at a restaurant on a Saturday evening.a. Find the frequency distribution and relative frequency distribution for these data.b. Construct a percentage bar chart for
Develop a table of row percentages for the contingency table you set up in Exercise 2.69. Using these row percentages, construct a percentage frequency distribution of overall design quality rating for each of the United States, the Pacific Rim, and Europe. Illustrate these three frequency
Consider constructing a frequency distribution and histogram for the perceived age estimates.a. Develop a frequency distribution, a relative frequency distribution, and a percent frequency distribution for the perceived age estimates using eight classes each of length 2.while the procedure
Construct a percent frequency polygon of the perceived age estimates. Use the classes of Exercise 2.71. In Exercise 2.71 Consider constructing a frequency distribution and histogram for the perceived age estimates. a. Develop a frequency distribution, a relative frequency distribution, and a
Construct a dot plot of the perceived age estimates and describe the shape of the distribution. What percentage of the perceived ages are below the industry’s code provision of 25 years old? Do you think that this percentage is too high?
Using the frequency distribution you developed in Exercise, develop:a. A cumulative frequency distribution.b. A cumulative relative frequency distribution.c. A cumulative percent frequency distribution.d. A percent frequency ogive of the perceived age estimates.e. How many perceived age estimates
Table 2.24 presents data concerning the largest U. S. charities in 2012 as rated on the Forbes.com website on August 3, 2013.a. Construct a percent frequency histogram of each of (1) the charities’ private support figures, (2) the charities’ total revenues, and (3) the charities’ fundraising
A basketball player practices free throws by taking 25 shots each day, and he records the number of shots missed each day in order to track his progress. The numbers of shots missed on days 1 through 30 are, respectively, 17, 15, 16, 18, 14, 15, 13, 12, 10, 11, 11, 10, 9, 10, 9, 9, 9, 10, 8, 10, 6,
In the Fall 1993 issue of VALIC Investment Digest, the Variable Annuity Life Insurance Company used pie charts to help give the following description of an investment strategy called rebalancing: Once you’ve established your ideal asset allocation mix, many experts recommend that you review your
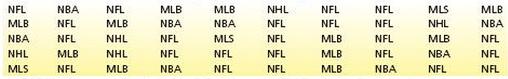
Fifty randomly selected adults who follow professional sports were asked to name their favorite professional sports league. The results are as follows where MLB Major League Baseball, MLS Major League Soccer, NBA National Basketball Association, NFL National Football League, and NHL National Hockey
The National Automobile Dealers Association (NADA) publishes AutoExec magazine, which annually reports on new vehicle sales and market shares by manufacturer. As given on the AutoExec magazine website in May 2006, new vehicle market shares in the United States for 2005 were as follows: 1 Chrysler/
Explain the difference between each of the following: a. A population parameter and its point estimate. b. A population mean and a corresponding sample mean.
Compute the mean team revenue and the median team revenue, and explain the difference between the values of these statistics.
Construct a histogram and a stem- and- leaf display of the teams’ player expenses.
Compute the mean team player expense and the median team player expense and explain the difference between the values of these statistics.
Construct a histogram and a stem- and- leaf display of the teams’ operating incomes.
Compute the mean team operating income and the median team operating income, and explain the difference between the values of these statistics.
The mean team operating income is the operating income each NBA team would receive if the NBA owners divided the total of their operating incomes equally among the 30 NBA teams. (Of course, some of the owners might object to dividing their operating incomes equally among the teams). a. How would
Define the range, variance, and standard deviation for a population.
Consider the following population of five numbers:5, 8, 10, 12, 15.Calculate the range, variance, and standard deviation of this population.
Explain how the population mean, median, and mode compare when the population’s relative frequency curve is a. Symmetrical. b. Skewed with a tail to the left. c. Skewed with a tail to the right.
Table 3.3 gives data concerning the 10 most valuable Nascar team valuations and their revenues as given on the Forbes.com website on June 14, 2011. Calculate the population range, variance, and standard deviation of the 10 valuations and of the 10 revenues. Nascar
Consider Exercise 3.20. Nascar a. Compute and interpret the z- score for each Nascar team valuation. b. Compute and interpret the z- score for each Nascar team revenue.
In order to control costs, a company wishes to study the amount of money its sales force spends entertaining clients. The following is a random sample of six entertainment expenses (dinner costs for four people) from expense reports submitted by members of the sales force.$ 157 $ 132 $ 109 $ 145 $
The mean and the standard deviation of the sample of 40 trash bag breaking strengths are 50.575and s= 1.6438.a. What does the histogram in Figure 2.17 (page 52) say about whether the Empirical Rule should be used to describe the trash bag breaking strengths? 50.575b. Use the Empirical Rule to
The mean and the standard deviation of the sample of 100 bank customer waiting times are and =5.46 and s = 2.475.a. What does the histogram in Figure 2.16 say about whether the Empirical Rule should be used to describe the bank customer waiting times?b. Use the Empirical Rule to calculate estimates
The mean and the standard deviation of the sample of 65 customer satisfaction ratings are=5.46 and s= 2.475a. What does the histogram in Figure 2.16 say about whether the Empirical Rule should be used to describe the bank customer waiting times?b. Use the Empirical Rule to calculate estimates of
Consider the 63 automatic teller machine (ATM) transaction times given in Table 3.4 above.a. Construct a histogram (or a stem- and- leaf display) for the 63 ATM transaction times. Describe the shape of the distribution of transaction times. ATMTimed. Explain why the Empirical Rule does not describe
Consider three stock funds, which we will call Stock Funds 1, 2, and 3. Suppose that Stock Fund 1 has a mean yearly return of 10.93 percent with a standard deviation of 41.96 percent, Stock Fund 2 has a mean yearly return of 13 percent with a standard deviation of 9.36 percent, and Stock Fund 3 has
Explain each of the following in your own words: a percentile; the first quartile, Q1 ; the third quartile, Q3 ; and the interquartile range, IQR.
Discuss how a box- and- whiskers display is used to identify outliers.
Calculate the mean, median, and mode of each of the following populations of numbers:a. 9, 8, 10, 10, 12, 6, 11, 10, 12, 8b. 110, 120, 70, 90, 90, 100, 80, 130, 140
Showing 16000 - 16100
of 88243
First
154
155
156
157
158
159
160
161
162
163
164
165
166
167
168
Last
Step by Step Answers
.png)
.png)
.png)
.png)
.png)
.png)
.png)
.png)
.png)
.png)
.png)
.png)
.png)
.png)
.png)
-1.png)
-2.png)
.png)

.png)
.png)
.png)
.png)
.png)
.png)
-2.png)

