New Semester
Started
Get
50% OFF
Study Help!
--h --m --s
Claim Now
Question Answers
Textbooks
Find textbooks, questions and answers
Oops, something went wrong!
Change your search query and then try again
S
Books
FREE
Study Help
Expert Questions
Accounting
General Management
Mathematics
Finance
Organizational Behaviour
Law
Physics
Operating System
Management Leadership
Sociology
Programming
Marketing
Database
Computer Network
Economics
Textbooks Solutions
Accounting
Managerial Accounting
Management Leadership
Cost Accounting
Statistics
Business Law
Corporate Finance
Finance
Economics
Auditing
Tutors
Online Tutors
Find a Tutor
Hire a Tutor
Become a Tutor
AI Tutor
AI Study Planner
NEW
Sell Books
Search
Search
Sign In
Register
study help
mathematics
statistics
Elementary Statistics 8th Edition Neil A. Weiss - Solutions
In a report titled Behavioral Risk Factor Surveillance System Summary Prevalence Report, the Centers for Disease Control and Prevention discusses the prevalence of diabetes in the United States. The following frequency distribution provides a diabetes prevalence frequency distribution for the 50
The following table provides a frequency distribution for the ages of adult women seeking pregnancy tests at public health facilities in Missouri during a 3-month period. It appeared in the article "Factors Affecting Contraceptive Use in Women Seeking Pregnancy Tests" (Family Planning Perspectives,
From the Florida State Center for Health Statistics report Women and Cardiovascular Disease Hospitalization, we obtained the following frequency distribution showing who paid for the hospitalization of female cardiovascular patients between the ages of 0 and 64 years in Florida during one
The U.S. Bureau of Citizenship and Immigration Services collects and reports information about naturalized persons in Statistical Yearbook. Suppose that a naturalized person is selected at random. Define events as follows:A = the person is younger than 20 years old,B = the person is between 30 and
The U.S. Census Bureau publishes data on housing units in American Housing Survey for the United States. The following table provides a frequency distribution for the number of rooms in U.S. housing units. The frequencies are in thousands. Rooms No. of units 1
A survey was conducted in Canada to ascertain public opinion about a major national park region in the Banff-Bow Valley. One question asked the amount that respondents would be willing to contribute per year to protect the environment in the Banff-Bow Valley region. The following frequency
Refer to Exercise 5.41.a. Are events A and B mutually exclusive?b. Are events B and C mutually exclusive?c. Are events A, C, and D mutually exclusive?d. Are there three mutually exclusive events among A, B, C, and D? four?
Each part of this exercise contains events from Exercise 5.42. In each case, decide whether the events are mutually exclusive.In Exercisea. A and B b. B and C c. A, B, and C d. A, B, and D e. A, B, C, and D
Draw a Venn diagram portraying four mutually exclusive events.
Interpret each of the following probability statements, using the frequentist interpretation of probability. a. The probability is 0.487 that a newborn baby will be a girl. b. The probability of a single ticket winning a prize in the Powerball lottery is 0.028. c. If a balanced dime is tossed three
Die and Coin. Consider the following random experiment: First, roll a die and observe the number of dots facing up; then, toss a coin the number of times that the die shows and observe the total number of heads. Thus, if the die shows three dots facing up and the coin (which is then tossed three
From 10 men and 8 women in a pool of potential jurors, 12 are chosen at random to constitute a jury. Suppose that you observe the number of men who are chosen for the jury. Let A be the event that at least half of the 12 jurors are men, and let B be the event that at least half of the 8 women are
Let A and B be events of a sample space. a. Suppose that A and (not B) are mutually exclusive. Explain why B occurs whenever A occurs. b. Suppose that B occurs whenever A occurs. Explain why A and (not B) are mutually exclusive. Extending the Concepts and Skills
Construct a Venn diagram that portrays four events, A, B, C, and D that have the following properties: Events A, B, and C are mutually exclusive; events A, B, and D are mutually exclusive; no other three of the four events are mutually exclusive.
Suppose that A, B, and C are three events that cannot all occur simultaneously. Does this condition necessarily imply that A, B, and C are mutually exclusive? Justify your answer and illustrate it with a Venn diagram.
Let A, B, and C be events of a sample space. Complete the following table.
According to the Congressional Directory, the official directory of the U.S. Congress, prepared by the Joint Committee on Printing, the age distribution for senators in the 109th U.S. Congress is as follows. Age (yr) No. of senators Under 50 ........... 12 50–59 ........... 33 60–69
Which of the following numbers could not possibly be probabilities? Justify your answer.a. 0.462 b. −0.201 c. 1d. 56e. 3.5 f. 0
The State of Texas maintains records pertaining to the economic development of corporations in the state. From the Economic Development Corporation Report, published by the Texas Comptroller of Public Accounts, we obtained the following frequency distribution summarizing the sales tax receipts from
The National Institute on Drug Abuse issued the report Monitoring the Future, which addressed the issue of drinking, cigarette, and smokeless tobacco use for eighth, tenth, and twelfth graders. During one year, 12,900 twelfth graders were asked the question, "How frequently have you smoked
The on-line publication Cyber Stats by Mediamark Research, Inc. reports Internet access and usage. The following is a percentage distribution of household income for households with home Internet access only.Suppose that a household with home Internet access only is selected at random. Let A denote
Coast Guard maintains a database of the number, source, and location of oil spills in U.S. navigable and territorial waters. The following is a probability distribution for location of oil spill events. [SOURCE: Statistical Abstract of the United States] Location
According to the U.S. Religious Landscape Survey, sponsored by the Pew Forum on Religion and Public Life, a distribution of religious affiliation among U.S. adults is as shown in the following table. Affiliation Relative frequency Protestant .......... 0.513 Catholic ............ 0.239 Jewish
Refer to Exercise 5.69. Use the complementation rule to find the probability that a randomly selected senator in the 109th Congress is Age (yr) No. of senators Under 50 ........... 12 50–59 ........... 33 60–69 ........... 32 70–79 ........... 18 80 and over .......... 5 a. 50 years
Mary Sheridan, a reporter for The Washington Post, wrote about a study describing the characteristics of day laborers in the Washington, D.C., area (June 23, 2005, pp. A1, A12). The study, funded by the Ford and Rockefeller Foundations, interviewed 476 day laborers-who are becoming common in the
The U.S. Bureau of Citizenship and Immigration Services collects and reports information about naturalized persons in Statistical Yearbook. Following is an age distribution for persons naturalized during one year.Suppose that one of these naturalized persons is selected at random. a. Without using
In the game of craps, a player rolls two balanced dice. Thirty-six equally likely outcomes are possible, as shown in Fig. 5.1 on page 187. Let A = event the sum of the dice is 7, B = event the sum of the dice is 11, C = event the sum of the dice is 2, D = event the sum of the dice is 3, E = event
Refer to Table 5.1, presented on page 185. a. List the possible samples without replacement of size 3 that can be obtained from the population of five officials. If a simple random sample without replacement of three officials is taken from the five officials, determine the probability that b. The
According to Current Population Reports, published by the U.S. Census Bureau, 51.6% of U.S. adults are female, 10.4% of U.S. adults are divorced, and 6.0% of U.S. adults are divorced females. For a U.S. adult selected at random, let F = event the person is female, and D = event the person is
Suppose that A and B be events such that P(A) = P(B) = 1/3, and P(A or B) = 1/2. a. Are events A and B mutually exclusive? Explain your answer. b. Determine P(A & B).
Suppose that A and B are mutually exclusive events. a. Use the special addition rule to express P(A or B) in terms of P(A) and P(B). b. Show that the general addition rule gives the same answer as that in part (a).
A certain city has three major newspapers, the Times, the Herald, and the Examiner. Circulation information indicates that 47.0% of households get the Times, 33.4% get the Herald, 34.6% get the Examiner, 11.9% get the Times and the Herald, 15.1% get the Times and the Examiner, 10.4% get the Herald
The general addition rule for two events is presented in Formula 5.3 on page 204 and that for three events is displayed on page 206. The General Addition Rule If A and B are any two events, then P(A or B) = P(A) + P(B) − P(A & B). a. Verify the general addition rule for three events. b. Write the
Let X denote the number of siblings of a randomly selected student. Explain the difference between {X = 3} and P(X = 3).
Refer to Table 5.1, presented on page 185. a. List the possible samples without replacement of size 4 that can be obtained from the population of five officials. If a simple random sample without replacement of four officials is taken from the five officials, determine the probability that b. The
The National Aeronautics and Space Administration (NASA) compiles data on space-shuttle launches and publishes them on its Web site. The following table displays a frequency distribution for the number of crew members on each shuttle mission from April 1981 to July 2000.Let X denote the crew size
From the document American Housing Survey for the United States, published by the U.S. Census Bureau, we obtained the following frequency distribution for the number of persons per occupied housing unit, where we have used "7" in place of "7 or more." Frequencies are in millions of housing
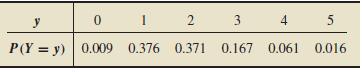
The Television Bureau of Advertising, Inc., publishes information on color television ownership in Trends in Television. Following is a probability distribution for the number of color TVs, Y, owned by a randomly selected household with annual income between $15,000 and $29,999.Use random-variable
A certain couple is equally likely to have either a boy or a girl. If the family has four children, let X denote the number of girls.a. Identify the possible values of the random variable X.b. Determine the probability distribution of X. (Hint: There are 16 possible equally likely outcomes. One is
When two balanced dice are rolled, 36 equally likely outcomes are possible, as depicted in Fig. 5.1 on page 187. Let Y denote the sum of the dice.a. What are the possible values of the random variable Y?b. Use random-variable notation to represent the event that the sum of the dice is 7.c. Find P(Y
The World Series in baseball is won by the first team to win four games (ignoring the 1903 and 1919-1921 World Series, when it was a best of nine). Thus it takes at least four games and no more than seven games to establish a winner. As found on the Major League Baseball Web site in World Series
An archer shoots an arrow into a square target 6 feet on a side whose center we call the origin. The outcome of this random experiment is the point in the target hit by the arrow. The archer scores 10 points if she hits the bull's eye-a disk of radius 1 foot centered at the origin; she scores 5
The Internal Revenue Service compiles data on income tax returns and summarizes its findings in Statistics of Income. The first two columns of Table 5.21 show a frequency distribution (number of returns) for adjusted gross income (AGI) from federal individual income tax returns, where K =
Refer to Problem 10. A federal individual income tax return is selected at random. Let H = event the return shows an AGI between $20K and $100K, I = event the return shows an AGI of less than $50K, J = event the return shows an AGI of less than $100K, and K = event the return shows an AGI of at
For the following groups of events from Problem 11, determine which are mutually exclusive. a. H and I b. I and K c. H and (not J) d. H, (not J), and K
Refer to Problems 10 and 11. a. Use the second column of Table 5.21 and the f/N rule to compute the probability of each of the events H, I, J, and K. b. Express each of the events H, I, J, and K in terms of the mutually exclusive events displayed in the third column of Table 5.21. c. Compute the
Consider the events (not J), (H & I ), (H or K), and (H & K) discussed in Problem 11. a. Find the probability of each of those four events, using the f/N rule and your answers from Problem 11. b. Compute P(J ), using the complementation rule and your answer for P (not J ) from part (a). c. In
Regarding the equal-likelihood model, a. What is it? b. How are probabilities computed?
Explain how the special formulas for the mean and standard deviation of a binomial random variable are derived.
a. The probability that you are dealt pocket aces is 1/221, or 0.00452 to three significant digits. Optional: Verify that probability by applying techniques found in Section P.5 of Module P (Further Topics in Probability) on the WeissStats CD. b. Using the result from part (a), obtain the
Answer true or false to each statement and explain your answers. a. For any two events, the probability that one or the other of the events occurs equals the sum of the two individual probabilities. b. For any event, the probability that it occurs equals 1 minus the probability that it does not
Identify one reason why the complementation rule is useful.
Given that 33.6% of all possible observations of the variable exceed 8, determine the area under the density curve that lies to the a. Right of 8. b. Left of 8.
In the article “Assessing Friendship Motivation During Preadolescence and Early Adolescence” (Journal of Early Adolescence, Vol. 25, No. 3, pp. 367–385), J. Richard and B. Schneider described the properties of the Friendship Motivation Scale for Children (FMSC), a scale designed to assess
In 1905, R. Pearl published the article “Biometrical Studies on Man. I. Variation and Correlation in Brain Weight” (Biometrika, Vol. 4, pp. 13–104). According to the study, brain weights of Swedish men are normally distributed with mean 1.40 kg and standard deviation 0.11 kg. Apply the
The A.C. Nielsen Company reported in the Nielsen Report on Television that the mean weekly television viewing time for children aged 2–11 years is 24.50 hours. Assume that the weekly television viewing times of such children are normally distributed with a standard deviation of 6.23 hours and
Refer to Example on page. The heights of the 3264 female students attending a midwestern college are approximately normally distributed with mean 64.4 inches and standard deviation 2.4 inches. Thus we can use the normal distribution with μ = 64.4 and σ = 2.4 to approximate the percentage of these
Women€™s Shoes. According to research, foot length of women is normally distributed with mean 9.58 inches and standard deviation 0.51 inch. This distribution is useful to shoe manufacturers, shoe stores, and related merchants because it permits them to make informed decisions about shoe
Opisthotrochopodus n. sp. is a polychaete worm that inhabits deep-sea hydrothermal vents along the Mid-Atlantic Ridge. According to the article “Reproductive Biology of Free-Living and Commensal Polynoid Polychaetes at the Lucky Strike Hydrothermal Vent Field (Mid-Atlantic Ridge)” (Marine
The rare booted eagle of western Europe was the focus of a study by S. Suarez et al. to identify optimal nesting habitat for this raptor. According to their paper “Nesting Habitat Selection by Booted Eagles (Hieraaetus pennatus) and Implications for Management” (Journal of Applied Ecology, Vol.
For a normally distributed variable, fill in the blanks. a. _____% of all possible observations lie within 1.96 standard deviations to either side of the mean. b. _____% of all possible observations lie within 1.64 standard deviations to either side of the mean. 6.
For a normally distributed variable, fill in the blanks. a. 99% of all possible observations lie within standard deviations to either side of the mean. b. 80% of all possible observations lie within standard deviations to either side of the mean 6.
Desert Samaritan Hospital in Mesa, Arizona, keeps records of emergency room traffic. Those records reveal that the times between arriving patients have a mean of 8.7 minutes with a standard deviation of 8.7 minutes. Based solely on the values of these two parameters, explain why it is unreasonable
Given that 28.4% of all possible observations of the variable are less than 11, determine the area under the density curve that lies to the a. Left of 11. b. Right of 11.
Let 0
Let x be a normally distributed variable with mean μ and standard deviation σ. a. Express the quartiles, Q1, Q2, and Q3, in terms of μ and σ. b. Express the kth percentile, Pk , in terms of μ, σ, and k
Explain in detail what a normal probability plot is and how it is used to assess the normality of a variable.
How is a normal probability plot used to detect outliers?
Explain how to obtain normal scores from Table III in Appendix A when a sample contains equal observations In each of Exercises
A sample of the final exam scores in a large introductory statistics course is as follows.a. Use Table III in Appendix A to construct a normal probability plot of the given data. b. Use part (a) to identify any outliers. c. Use part (a) to assess the normality of the variable under consideration.
In an issue of Consumer Reports, different cell phone providers and plans were compared. The monthly fees, in dollars, for a sample of the providers and plans are shown in the following table.a. Use Table III in Appendix A to construct a normal probability plot of the given data. b. Use part (a)
The following table displays finishing times, in seconds, for the winners of fourteen 1-mile thoroughbred horse races, as found in two recent issues of Thoroughbred Times.a. Use Table III in Appendix A to construct a normal probability plot of the given data. b. Use part (a) to identify any
The Bureau of Labor Statistics publishes information on average annual expenditures by consumers in the Consumer Expenditure Survey. In 2005, the mean amount spent by consumers on nonalcoholic beverages was $303. A random sample of 12 consumers yielded the following data, in dollars, on last
In the special report €œMousetrap: The Most-Visited Shoe and Apparel E-tailers€ (Footwear News, Vol. 58, No. 3, p. 18), we found the following data on the average time, in minutes, spent per user per month from January to June of one year for a sample of 15 shoe and apparel retail Web
The following table provides the daily charges, in dollars, for a sample of 15 hotels and motels operating in South Carolina. The data were found in the report South Carolina Statistical Abstract, sponsored by the South Carolina Budget and Control Board.a. Obtain a normal probability plot of the
In the article €œDistribution of Oxygen in Surface Sediments from Central Sagami Bay, Japan: In Situ Measurements by Microelectrodes and Planar Optodes€ (Deep Sea Research Part I: Oceanographic Research Papers, Vol. 52, Issue 10, pp. 1974€“1987), R. Glud et al.
In the article €œMaterial Culture as Memory: Combs and Cremations in Early Medieval Britain€ (Early Medieval Europe, Vol. 12, Issue 2, pp. 89€“128), H. Williams discussed the frequency of cremation burials found in 17 archaeological sites in eastern England. Here are
A study by researchers at the University of Maryland addressed the question of whether the mean body temperature of humans is 98.6◦F. The results of the study by P. Mackowiak et al. appeared in the article “A Critical Appraisal of 98.6◦F, the Upper Limit of the Normal Body Temperature, and
Philosophical and health issues are prompting an increasing number of Taiwanese to switch to a vegetarian lifestyle. In the paper “LDL of Taiwanese Vegetarians Are Less Oxidizable than Those of Omnivores” (Journal of Nutrition, Vol. 130, pp. 1591–1596), S. Lu et al. compared the daily intake
Students in an introductory statistics course at the U.S. Air Force Academy participated in Nabisco’s “Chips Ahoy! 1,000 Chips Challenge” by confirming that there were at least 1000 chips in every 18-ounce bag of cookies that they examined. As part of their assignment, they concluded that the
In 1902, W. R. Macdonell published the article €œOn Criminal Anthropometry and the Identification of Criminals€ (Biometrika,Vol. 1, pp. 177€“227). Among other things, the author presented data on the left middle finger length, in centimeters. The following table provides the midpoints
For humans, gestation periods are normally distributed with a mean of 266 days and a standard deviation of 16 days. a. Use the technology of your choice to simulate four random samples of 50 human gestation periods each. b. Obtain a normal probability plot of each sample in part (a). c. Are the
Explain in your own words why a density curve has the two properties listed in Key Fact on page.
Two normally distributed variables have the same means and the same standard deviations. What can you say about their distributions? Explain your answer.
Consider two normal distributions, one with mean −4 and standard deviation 3, and the other with mean 6 and standard deviation 3. Answer true or false to each statement and explain your answers. a. The two normal distributions have the same shape. b. The two normal distributions are centered at
Consider two normal distributions, one with mean −4 and standard deviation 3, and the other with mean −4 and standard deviation 6. Answer true or false to each statement and explain your answers. a. The two normal distributions have the same shape. b. The two normal distributions are centered
True or false: The mean of a normal distribution has no effect on its shape. Explain your answer.
Sketch the normal distribution with a. μ = 3 and σ = 3. b. μ = 1 and σ = 3. c. μ = 3 and σ = 1.
Sketch the normal distribution with a. μ = −2 and σ = 2. b. μ = −2 and σ = 1/2. c. μ = 0 and σ = 2.
For a normally distributed variable, what is the relationship between the percentage of all possible observations that lie between 2 and 3 and the area under the associated normal curve between 2 and 3? What if the variable is only approximately normally distributed?
For a normally distributed variable, what is the relationship between the percentage of all possible observations that lie to the right of 7 and the area under the associated normal curve to the right of 7? What if the variable is only approximately normally distributed?
The area under a particular normal curve between 10 and 15 is 0.6874. A normally distributed variable has the same mean and standard deviation as the parameters for this normal curve. What percentage of all possible observations of the variable lie between 10 and 15? Explain your answer.
Refer to Example on page. a. Use the relative-frequency distribution in Table to obtain the percentage of female students who are between 60 and 65 inches tall. b. Use your answer from part (a) to estimate the area under the normal curve having parameters μ = 64.4 and σ = 2.4 that lies between
Refer to Example on page.a. The area under the standard normal curve with parameters μ = 64.4 and σ = 2.4 that lies to the left of 61 is 0.0783. Use this information to estimate the percentage of female students who are shorter than 61 inches.b. Use the relative-frequency
Giant Tarantulas. One of the larger species of tarantulas is the Grammostola mollicoma, whose common name is the Brazilian giant tawny red. A tarantula has two body parts. The anterior part of the body is covered above by a shell, or carapace. From a recent article by F. Costa and F. Perez–Miles
According to the National Health and Nutrition Examination Survey, published by the National Center for Health Statistics, the serum (noncellular portion of blood) total cholesterol level of U.S. females 20 years old or older is normally distributed with a mean of 206 mg/dL (milligrams per
As reported in Runner’s World magazine, the times of the finishers in the New York City 10-km run are normally distributed with mean 61 minutes and standard deviation 9 minutes. Let x denote finishing time for finishers in this race. a. Sketch the distribution of the variable x. b. Obtain the
From the paper “Effects of Chronic Nitrate Exposure on Gonad Growth in Green Sea Urchin Strongylocentrotus droebachiensis” (Aquaculture, Vol. 242, No. 1–4, pp. 357–363) by S. Siikavuopio et al., we found that weights of adult green sea urchins are normally distributed with mean 52.0 g and
From the document National Vital Statistics Reports, a publication of the National Center for Health Statistics, we obtained the following frequency distribution for the ages of women who became mothers during one year.a. Obtain a relative-frequency histogram of these age data. b. Based on your
Showing 24400 - 24500
of 88243
First
238
239
240
241
242
243
244
245
246
247
248
249
250
251
252
Last
Step by Step Answers
.png)
.png)
.png)
.png)
.png)
.png)
.png)
.png)
.png)
.png)
.png)
.png)
.png)
.png)
.png)
.png)
.png)
.png)
.png)
.png)
.png)
.png)

