New Semester
Started
Get
50% OFF
Study Help!
--h --m --s
Claim Now
Question Answers
Textbooks
Find textbooks, questions and answers
Oops, something went wrong!
Change your search query and then try again
S
Books
FREE
Study Help
Expert Questions
Accounting
General Management
Mathematics
Finance
Organizational Behaviour
Law
Physics
Operating System
Management Leadership
Sociology
Programming
Marketing
Database
Computer Network
Economics
Textbooks Solutions
Accounting
Managerial Accounting
Management Leadership
Cost Accounting
Statistics
Business Law
Corporate Finance
Finance
Economics
Auditing
Tutors
Online Tutors
Find a Tutor
Hire a Tutor
Become a Tutor
AI Tutor
AI Study Planner
NEW
Sell Books
Search
Search
Sign In
Register
study help
mathematics
statistics
Elementary Statistics 8th Edition Neil A. Weiss - Solutions
Drunk-driving fatalities represent the total number of people (occupants and non-occupants) killed in motor vehicle traffic crashes in which at least one driver had a blood alcohol content (BAC) of 0.08 or higher. The following graph, titled "Drunk Driving Fatalities Down 38%. Despite a 31%
From the Oil-price.net Web site, we obtained the graph in the next column showing crude oil prices, in dollars per barrel, for a 1-month period beginning October 12, 2008.a. Cover the numbers on the vertical axis of the graph with a piece of paper.b. What impression does the graph convey regarding
Refer to Example 2.26 on page 80. Suggest a way in which the developer can accurately illustrate that twice as many homes will be built in the area this year as last.In exercise
A golf ball manufacturer has determined that a newly developed process results in a ball that lasts roughly twice as long as a ball produced by the current process. To illustrate this advance graphically, she designs a brochure showing a "new" ball having twice the radius of the "old" ball.a. What
Several companies conduct reviews and perform rankings of products of special interest to consumers. One such company is TopTenReviews, Inc. As of October 2008, the top 10 smartphones, according to TopTenReviews, Inc., are as shown in the second column of the following table. Identify the type of
Explain the difference between a. Frequency and relative frequency. b. Percentage and relative frequency.
Answer true or false to each of the statements in parts (a) and (b), and explain your reasoning. a. Two data sets that have identical frequency distributions have identical relative-frequency distributions. b. Two data sets that have identical relative-frequency distributions have identical
The networks for the top 20 television shows, as determined by the Nielsen Ratings for the week ending October 26, 2008, are shown in the following table.a. Determine a frequency distribution.b. Obtain a relative-frequency distribution.c. Draw a pie chart.d. Construct a bar chart.
From NCAA.com€”the official Web site for NCAA sports€”we obtained the National Collegiate Athletic Association wrestling champions for the years 1984€“2008. They are displayed in the following table.a. Determine a frequency distribution.b. Obtain a relative-frequency distribution.c.
Explain the meaning of a. Qualitative variable. b. Discrete, quantitative variable. c. Continuous, quantitative variable.
The following table provides data on college for the students in one section of the course Introduction to Computer Science during one semester at Arizona State University. In the table, we use the abbreviations BUS for Business, ENG for Engineering and Applied Sciences, and LIB for Liberal Arts
Earlier in this section, we considered the political party affiliations of the students in Professor Weiss€™s introductory statistics course. The class levels of those students are as follows, where Fr, So, Jr, and Sr denote freshman, sophomore, junior, and senior, respectively.a. Determine a
The U.S. Census Bureau divides the states in the United States into four regions: Northeast (NE), Midwest (MW), South (SO), and West (WE). The following table gives the region of each of the 50 states.a. Determine a frequency distribution.b. Obtain a relative-frequency distribution.c. Draw a pie
The report Controlling Road Rage: A Literature Review and Pilot Study was prepared for the AAA Foundation for Traffic Safety by D. Rathbone and J. Huckabee. The authors discuss the results of a literature review and pilot study on how to prevent aggressive driving and road rage. As described in the
The Department of Justice and the Federal Bureau of Investigation publish a compilation on crime statistics for the United States in Crime in the United States. The following table provides a frequency distribution for robbery type during a one-year period.Robbery type FrequencyStreet/highway
Observing that the proportion of blue M&Ms in his bowl of candy appeared to be less than that of the other colors, R. Fricker, Jr., decided to compare the color distribution in randomly chosen bags of M&Ms to the theoretical distribution reported by M&M/MARS consumer affairs. Fricker
The Higher Education Research Institute of the University of California, Los Angeles, publishes information on characteristics of incoming college freshmen in The American Freshman. In 2000, 27.7% of incoming freshmen characterized their political views as liberal, 51.9% as moderate, and 20.4% as
The Women Physicians Congress compiles data on medical school faculty and publishes the results in AAMC Faculty Roster. The following table presents a frequency distribution of rank for medical school faculty during one year. Rank FrequencyProfessor ..............24,418Associate
From the Florida State Center for Health Statistics report Women and Cardiovascular Disease Hospitalizations, we obtained the following frequency distribution showing who paid for the hospitalization of female cardiovascular patients under 65 years of age in Florida during one year. Payer
An American roulette wheel contains 18 red numbers, 18 black numbers, and 2 green numbers. The following table shows the frequency with which the ball landed on each color in 200 trials.a. Obtain a relative-frequency distribution.b. Draw a pie chart.c. Construct a bar chart.
Explain the meaning of a. Qualitative data. b. Discrete, quantitative data. c. Continuous, quantitative data.
The American Automobile Manufacturers Association compiles data on U.S. car sales by type of car. Results are published in the World Almanac. A random sample of last year’s car sales yielded the car-type data on the WeissStats CD.a. Determine a frequency distribution.b. Obtain a
The American Hospital Association conducts annual surveys of hospitals in the United States and publishes its findings in AHA Hospital Statistics. Data on hospital type for U.S. registered hospitals can be found on the WeissStats CD. For convenience, we use the following abbreviations:NPC:
Research by W. Clark and L. Midanik (Alcohol Consumption and Related Problems: Alcohol and Health Monograph 1. DHHS Pub. No. (ADM) 82–1190) examined, among other issues, alcohol consumption patterns of U.S. adults by marital status. Data for marital status and number of drinks per month, based on
In Issue 338 of the Amstat News, thenpresident of the American Statistical Association, F. Scheuren, reported the results of a survey on how members would prefer to receive ballots in annual elections. On the WeissStats CD, you will find data for preference and highest degree obtained for the 566
State three of the most important guidelines in choosing the classes for grouping a quantitative data set.
With regard to grouping quantitative data into classes in which each class represents a range of possible values, we discussed two methods for depicting the classes. Identify the two methods and explain the relative advantages and disadvantages of each method.
For quantitative data, we examined three types of grouping: single-value grouping, limit grouping, and cutpoint grouping. For each type of data given, decide which of these three types is usually best. Explain your answers. a. Continuous data displayed to one or more decimal places b. Discrete data
Explain the advantages and disadvantages of frequency histograms versus frequency distributions.
For data that are grouped in classes based on more than a single value, lower class limits (or cutpoints) are used on the horizontal axis of a histogram for depicting the classes. Class marks (or midpoints) can also be used, in which case each bar is centered over the mark (or midpoint) of the
Discuss the relative advantages and disadvantages of stemand leaf diagrams versus frequency histograms.
Suppose that you have a data set that contains a large number of observations. Which graphical display is generally preferable: a histogram or a stem-and-leaf diagram? Explain your answer.
Suppose that you have constructed a stem-and-leaf diagram and discover that it is only moderately useful because there are too few stems. How can you remedy the problem?
The additional sleep, to the nearest tenth of an hour, obtained by a sample of 100 patients by using a particular brand of sleeping pill We have presented a “data scenario.” In each case, decide which type of grouping (single-value, limit, or cutpoint) is probably the best.
The gas mileages, rounded to the nearest number of miles per gallon, of all new car models We have presented a “data scenario.” In each case, decide which type of grouping (single-value, limit, or cutpoint) is probably the best.
Professor Weiss asked his introductory statistics students to state how many siblings they have. The responses are shown in the following table. Use single-value grouping.a. Determine a frequency distribution.b. Obtain a relative-frequency distribution.c. Construct a frequency histogram based on
The U.S. Census Bureau conducts nationwide surveys on characteristics of U.S. households and publishes the results in Current Population Reports. Following are data on the number of people per household for a sample of 40 households. Use single-value grouping.a. Determine a frequency
In the paper "The Eastern Cottonmouth (Agkistrodon piscivorus) at the Northern Edge of Its Range" (Journal of Herpetology, Vol. 29, No. 3, pp. 391-398), C. Blem and L. Blem examined the reproductive characteristics of the eastern cottonmouth, a once widely distributed snake whose numbers have
According to the News Generation, Inc. Web site€™s Radio Facts and Figures, which has as its source Arbitron Inc., the mean number of radios per U.S. household was 5.6 in 2008. A random sample of 45 U.S. households taken this year yields the following data on number of radios owned. Use
The U.S. Energy Information Administration collects data on residential energy consumption and expenditures. Results are published in the document Residential Energy Consumption Survey: Consumption and Expenditures. The following table gives one year€™s energy consumption for a sample of 50
Dementia is a person€™s loss of intellectual and social abilities that is severe enough to interfere with judgment, behavior, and daily functioning. Alzheimer€™s disease is the most common type of dementia. In the article €œLiving with Early Onset Dementia: Exploring the Experience and
The U.S. Department of Agriculture reports in Food Consumption, Prices, and Expenditures that the average American consumed about 32 lb of cheese in 2007. Cheese consumption has increased steadily since 1960, when the average American ate only 8.3 lb of cheese annually. The following table provides
Patients who undergo chronic hemodialysis often experience severe anxiety. Videotapes of progressive relaxation exercises were shown to one group of patients and neutral videotapes to another group. Then both groups took the State-Trait Anxiety Inventory, a psychiatric questionnaire used to measure
The Public Citizen Health Research Group (the "group") calculated the rate of serious disciplinary actions per 1000 doctors in each state. Using state-bystate data from the Federation of State Medical Boards (FSMB) on the number of disciplinary actions taken against doctors in 2007, combined with
The viewing audiences, in millions, for the top 20 television shows, as determined by the Nielsen Ratings for the week ending October 26, 2008, are shown in the following table. Use cutpoint grouping with a first class of 12€“under 13.a. Determine a frequency distribution.b. Obtain a
The cheetah (Acinonyx jubatus) is the fastest land mammal and is highly specialized to run down prey. The cheetah often exceeds speeds of 60 mph and, according to the online document "Cheetah Conservation in Southern Africa" (Trade & Environment Database (TED) Case Studies, Vol. 8, No. 2) by J.
Consumer Reports provides information on new automobile models, including price, mileage ratings, engine size, body size, and indicators of features. A simple random sample of 35 new models yielded the following data on fuel tank capacity, in gallons. Use cutpoint grouping with 12 as the first
In the article "Distribution of Oxygen in Surface Sediments from Central Sagami Bay, Japan: In Situ Measurements by Microelectrodes and Planar Optodes" (Deep Sea Research Part I: Oceanographic Research Papers, Vol. 52, Issue 10, pp. 1974-1987), R. Glud et al. explored the distributions of oxygen in
Construct a dotplot for the following exam scores of the students in an introductory statistics class.
The Motor Vehicle Manufacturers Association of the United States publishes information in Motor Vehicle Facts and Figures on the ages of cars and trucks currently in use. A sample of 37 trucks provided the ages, in years, displayed in the following table. Construct a dotplot for the ages.
Frustrated passengers, congested streets, time schedules, and air and noise pollution are just some of the physical and social pressures that lead many urban bus drivers to retire prematurely with disabilities such as coronary heart disease and stomach disorders. An intervention program designed by
Several neurosurgeons wanted to determine whether a dynamic system (Z-plate) reduced the number of acute postoperative days in the hospital relative to a static system (ALPS plate). R. Jacobowitz, Ph.D., an Arizona State University professor, along with G. Vishteh, M.D., and other neurosurgeons
A soft-drink bottler fills bottles with soda. For quality assurance purposes, filled bottles are sampled to ensure that they contain close to the content indicated on the label. A sample of 30 "one-liter" bottles of soda contain the amounts, in milliliters, shown in following table. Construct a
In an issue of Science (Vol.308, No. 5721, p. 483), D. Normile reported on a study from the Japan Statistics Bureau of the 30 industrialized countries in the Organization for Economic Co-operation and Development (OECD) titled "Japan Mulls Workforce Goals for Women." Following are the percentages
How Hot Does It Get? The highest temperatures on record for selected cities are collected by the U.S. National Oceanic and Atmospheric Administration and published in Comparative Climatic Data. The following table displays data for years through 2007.a. What type of data is presented in the second
R. Morris and E. Watson studied various aspects of process capability in the paper "Determining Process Capability in a Chemical Batch Process" (Quality Engineering, Vol. 10(2), pp. 389-396). In one part of the study, the researchers compared the variability in product of a particular piece of
The number of patents a university receives is an indicator of the research level of the university. From a study titled Science and Engineering Indicators issued by the National Science Foundation, we found the number of U.S. patents awarded to a sample of 36 private and public universities to be
From phillies.mlb.com, the official Web site of the 2008World Series champion Philadelphia Phillies major league baseball team, we obtained the data shown on the next page on the heights, in inches, of the players on the roster.a. Construct a stem-and-leaf diagram of these data with five lines per
From tampabay.rays.mlb.com, the official Web site of the 2008 American League champion Tampa Bay Rays major league baseball team, we obtained the following data on the heights, in inches, of the players on the roster.a. Construct a stem-and-leaf diagram of these data with five lines per stem. b.
The Internal Revenue Service (IRS) publishes data on adjusted gross incomes in Statistics of Income, Individual Income Tax Returns. The following relative frequency histogram shows one year's individual income tax returns for adjusted gross incomes of less than $50,000.Use the histogram and the
According to the National Health and Nutrition Examination Survey, published by the Centers for Disease Control and Prevention, the average cholesterol level for children between 4 and 19 years of age is 165 mg/dL. A pediatrician who tested the cholesterol levels of several young patients was
In an article titled "Great White, Deep Trouble" (National Geographic, Vol. 197(4), pp. 2-29), Peter Benchley-the author of JAWS-discussed various aspects of the Great White Shark (Carcharodon carcharias). Data on the number of pups borne in a lifetime by each of 80 Great White Shark females are
From the Recording Industry Association of AmericaWeb site, we obtained data on the number of albums sold, in millions, for the top recording artists (U.S. sales only) as of November 6, 2008. Those data are provided on the WeissStats CD. Use the technology of your choice to a. Obtain frequency and
As reported by the U.S. Census Bureau in Current Population Reports, the percentage of adults in each state and the District of Columbia who have completed high school is provided on the WeissStats CD. Apply the technology of your choice to construct a stem-and-leaf diagram of the percentages
The U.S. Federal Bureau of Investigation publishes annual crime rates for each state and the District of Columbia in the document Crime in the United States. Those rates, given per 1000 population, are provided on the WeissStats CD. Apply the technology of your choice to construct a stem-and-leaf
From Forbes, we obtained a list of the deceased celebrities with the top five earnings during the 12-month period ending October 2005. The estimates measure pretax gross earnings before management fees and other expenses. In some cases, proceeds from estate auctions are included.a. What type of
A study by researchers at the University of Maryland addressed the question of whether the mean body temperature of humans is 98.6◦F. The results of the study by P. Mackowiak et al. appeared in the article "A Critical Appraisal of 98.6◦F, the Upper Limit of the Normal Body Temperature, and
The exam scores for the students in an introductory statistics class are as follows.a. Group these exam scores, using the classes 30-39, 40-49, 50- 59, 60-69, 70-79, 80-89, and 90-100.b. What are the widths of the classes?c. If you wanted all the classes to have the same width, what classes would
Refer to the days-to-maturity data in Table 2.6 on page 51. Note that there are 40 observations, the smallest and largest of which are 36 and 99, respectively. Apply the preceding procedure to choose classes for limit grouping. Use approximately seven classes. If in Step 2 you decide on 10 for the
Refer to the weight data in Table 2.8 on page 53. Note that there are 37 observations, the smallest and largest of which are 129.2 and 278.8, respectively. Apply the preceding procedure to choose classes for cutpoint grouping. Use approximately eight classes. Note: If in Step 2 you decide on 20 for
The following bivariate data on age (in years) and gender were obtained from the students in a freshman calculus course. The data show, for example, that the first student on the list is 21 years old and is a male.a. Group these data in the following contingency table. For the first student, place
Construct a relative frequency polygon for the energy-consumption data given in Exercise 2.56. Use the classes specified in that exercise.In exercise
Construct a relative-frequency polygon for the speed data given in Exercise 2.61. Use the classes specified in that exercise.In exercise
Refer to the energy consumption data given in Exercise 2.56.a. Construct a table similar to Table 2.14 for the data, based on the classes specified in Exercise 2.56. Interpret your results.b. Construct an ogive for the data.
Refer to the speed data given in Exercise 2.61.In exercise 2.61.The cheetah (Acinonyx jubatus) is the fastest land mammal and is highly specialized to run down prey. The cheetah often exceeds speeds of 60 mph and, according to the online document "Cheetah Conservation in Southern Africa" (Trade
According to JiWire, Inc., the top 10 countries by number of Wi-Fi locations, as of October 27, 2008, are as shown in the following table.Identify the type of data provided by the information in each of the following columns of the table: a. First b. Second c. Third
The Florida State Center for Health Statistics reported in Women and Cardiovascular Disease Hospitalizations that, for cardiovascular hospitalizations, the mean age of women is 71.9 years. At one hospital, a random sample of 20 female cardiovascular patients had the following ages, in years.a.
Refer to Exercise 2.68. a. Round each observation to the nearest 10 ml, drop the terminal 0s, and then obtain a stem-and-leaf diagram of the resulting data. b. Truncate each observation by dropping the units digit, and then construct a stem-and-leaf diagram of the truncated data. c. Compare the
In the special report "Mousetrap: The Most-Visited Shoe and Apparel E-tailers" (Footwear News, Vol. 58, No. 3, p. 18), we found the following data on the average time, in minutes, spent per user per month from January to June of one year for a sample of 15 shoe and apparel retail Web sites.The
This problem is about variables and data. a. What is a variable? b. Identify two main types of variables. c. Identify the two types of quantitative variables. d. What are data? e. How is data type determined?
A quantitative data set has been grouped by using cutpoint grouping with equal-width classes. a. If the lower and upper cutpoints of the first class are 5 and 15, respectively, what is the common class width? b. What is the midpoint of the second class? c. What are the lower and upper cutpoints of
A quantitative data set has been grouped by using cutpoint grouping with equal-width classes of width 8. a. If the midpoint of the first class is 10, what are its lower and upper cutpoints? b. What is the class midpoint of the second class? c. What are the lower and upper cutpoints of the third
Explain the relative positioning of the bars in a histogram to the numbers that label the horizontal axis when each of the following quantities is used to label that axis. a. Lower class limits b. Lower class cutpoints c. Class marks d. Class midpoints
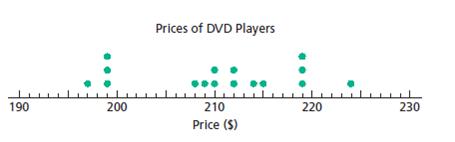
Refer to Example 2.16 on page 57.a. Explain why a frequency histogram of the DVD prices with single-value classes would be essentially identical to the dotplot shown in Fig. 2.7.b. Would the dotplot and a frequency histogram be essentially identical with other than single-value classes? Explain
Sketch the curve corresponding to each of the following distribution shapes. a. Bell shaped b. Right skewed c. Reverse J shaped d. Uniform
Make an educated guess as to the distribution shape of each of the following variables. Explain your answers. a. Height of American adult males b. Annual income of U.S. households c. Age of full-time college students d. Cumulative GPA of college seniors
A variable of a population has a left-skewed distribution. a. If a large simple random sample is taken from the population, roughly what shape will the distribution of the sample have? Explain your answer. b. If two simple random samples are taken from the population, would you expect the two
The world's five largest hydroelectric plants, based on ultimate capacity, are as shown in the following table. Capacities are in megawatts.a. What type of data is given in the first column of the table? b. What type of data is given in the fourth column? c. What type of data is given in the third
From the Information Please Almanac, we obtained the ages at inauguration for the first 44 presidents of the United States (from George Washington to Barack H. Obama).a. Identify the classes for grouping these data, using limit grouping with classes of equal width 5 and a first class of 40-44.b.
Refer to Problem 18. Construct a dotplot for the ages at inauguration of the first 44 presidents of the United States.In exercise
For a qualitative data set, what is a a. Frequency distribution? b. Relative-frequency distribution?
Refer to Problem 18. Construct a stem and leaf diagram for the inauguration ages of the first 44 presidents of the United States.In exercisea. Use one line per stem. b. Use two lines per stem. c. Which of the two stem-and-leaf diagrams that you just constructed corresponds to the frequency
The Prescott National Bank has six tellers available to serve customers. The data in the following table provide the number of busy tellers observed during 25 spot checks.a. Use single-value grouping to organize these data into frequency and relative-frequency distributions.b. Draw a
The Air Travel Consumer Report is a monthly product of the Department of Transportation's Office of Aviation Enforcement and Proceedings. The report is designed to assist consumers with information on the quality of services provided by the airlines. Following are the percentages of on-time
From the ESPN Web site, we obtained the age of the oldest player on each of the major league baseball teams during one season. Here are the data.a. Construct a dotplot for these data. b. Use your dotplot from part (a) to identify the overall shape of the distribution of these ages. c. State whether
In the article "Missing the Target: A Comparison of Buyback and Fatality Related Guns" (Injury Prevention, Vol. 8, pp. 143-146), Kuhn et al. examined the relationship between the types of guns that were bought back by the police and the types of guns that were used in homicides in Milwaukee during
The U.S. Census Bureau divides the states in the United States into nine divisions: East North Central (ENC), East South Central (ESC), Middle Atlantic (MAC), Mountain (MTN), New England (NED), Pacific (PAC), South Atlantic (SAC), West North Central (WNC), and West South Central (WSC). The
From the document Dow Jones Industrial Average Historical Performance, published by Dow Jones & Company, we obtained the annual high closes for the Dow for the years 1984-2008.a. Construct frequency and relative-frequency distributions for the high closes, in thousands. Use cutpoint grouping with
In the article, "Squeaky Clean Fossil Fuels" (New Scientist, Vol. 186, No. 2497, p. 26), F. Pearce reported on the benefits of using clean fossil fuels that release no carbon dioxide (CO2), helping to reduce the threat of global warming. One technique of slowing down global warming caused by CO2 is
The following graph is based on one that appeared in an Arizona Republic newspaper article entitled "Hand That Rocked Cradle Turns to Work as Women Reshape U.S. Labor Force." The graph depicts the labor force participation rates for the years 1960, 1980, and 2000.a. Cover the numbers on the
Showing 23900 - 24000
of 88243
First
233
234
235
236
237
238
239
240
241
242
243
244
245
246
247
Last
Step by Step Answers
.png)
.png)
.png)
.png)
.png)
.png)
.png)
.png)
.png)
.png)
.png)
.png)
.png)
.png)
.png)
.png)
.png)
.png)
.png)
.png)
.png)
.png)
.png)
.png)
.png)
.png)
.png)
.png)
.png)
.png)
.png)
.png)
.png)
.png)
.png)
.png)
.png)
.png)
.png)
-1.png)
-2.png)
-1.png)
-2.png)
-3.png)
.png)
.png)
.png)
.png)
.png)
.png)
-1.png)
-2.png)
.png)
.png)
.png)
.png)
.png)
.png)
.png)
.png)
.png)
.png)
.png)
.png)

