New Semester
Started
Get
50% OFF
Study Help!
--h --m --s
Claim Now
Question Answers
Textbooks
Find textbooks, questions and answers
Oops, something went wrong!
Change your search query and then try again
S
Books
FREE
Study Help
Expert Questions
Accounting
General Management
Mathematics
Finance
Organizational Behaviour
Law
Physics
Operating System
Management Leadership
Sociology
Programming
Marketing
Database
Computer Network
Economics
Textbooks Solutions
Accounting
Managerial Accounting
Management Leadership
Cost Accounting
Statistics
Business Law
Corporate Finance
Finance
Economics
Auditing
Tutors
Online Tutors
Find a Tutor
Hire a Tutor
Become a Tutor
AI Tutor
AI Study Planner
NEW
Sell Books
Search
Search
Sign In
Register
study help
mathematics
statistics
Applied Statistics In Business And Economics 4th Edition David Doane, Lori Seward - Solutions
The target population is all students in your university. You wish to estimate the average current Visa balance for each student. How large would the university student population have to be in order to be regarded as effectively infinite in each of the following samples? a. A sample of 10
What type of data (categorical, discrete numerical, or continuous numerical) is each of the following variables? If there is any ambiguity, explain why the answer is unclear. a. Length of a TV commercial. b. Number of peanuts in a can of Planter’s Mixed Nuts. c. Occupation of a mortgage
Referring to the previous question, would a simple random sample be possible?
What sources of error might you encounter if you want to know (a) About the dating habits of college men, so you go to a dorm meeting and ask students how many dates they have had in the last year; (b) How often people attend religious services, so you stand outside a particular church on Sunday
What kind of survey (mail, telephone, interview, web, direct observation) would you recommend for each of the following purposes, and why? What problems might be encountered? a. To estimate the proportion of students at your university who would prefer a web-based statistics class to a regular
What kind of survey (mail, telephone, interview, web, direct observation) would you recommend that a small laundry and dry cleaning business use for each of the following purposes, and why? a. To estimate the proportion of customers preferring opening hours at 7 a.m. instead of 8 a.m. b. To
Which type of data (categorical, discrete numerical, continuous numerical) is each of the following variables? a. Age of a randomly chosen tennis player in the Wimbledon tennis tournament. b. Nationality of a randomly chosen tennis player in the Wimbledon tennis tournament. c. Number of double
What type of data (categorical, discrete numerical, or continuous numerical) is each of the following variables? If there is any ambiguity about the data type, explain why the answer is unclear. a. The miles on your car’s odometer. b. The fat grams you ate for lunch yesterday. c. The name of the
Which type of data (categorical, discrete numerical, continuous numerical) is each of the following variables? a. Number of spectators at a randomly chosen Wimbledon tennis match. b. Water consumption (liters) by a randomly chosen Wimbledon player during a match. c. Gender of a randomly chosen
Which measurement level (nominal, ordinal, interval, ratio) is each of the following variables? a. A customer’s ranking of five new hybrid vehicles. b. Noise level 100 meters from the Dan Ryan Expressway at a randomly chosen moment. c. Number of occupants in a randomly chosen commuter vehicle on
Which measurement level (nominal, ordinal, interval, ratio) is each of the following variables? a. Number of annual office visits by a particular Medicare subscriber. b. Daily caffeine consumption by a six-year-old child. c. Type of vehicle driven by a college student.
Below are 15 questions from a survey that was administered to a sample of MBA students Answers were recorded on paper in the blank at the left of each question. For each question, state the data type (categorical, discrete numerical, or continuous numerical) and measurement level (nominal, ordinal,
Identify the following data as either time series or cross-sectional. a. The 2007 CEO compensation of the 500 largest U.S. companies. b. The annual compensation for the CEO of Coca-Cola Enterprises from 1990 to 2009. c. The weekly revenue for a Noodles & Company restaurant for the 52 weeks in
Identify the following data as either time series or cross-sectional. a. The number of rooms booked each night for the month of January 2010 at a Vail Resorts hotel. b. The amount spent on books at the start of this semester by each student in your statistics class. c. The number of Caesar salads
Would you use a sample or a census to measure each of the following? Why? If you are uncertain, explain the issues. a. The number of cans of Campbell’s soup on your local supermarket’s shelf today at 6:00 p.m. b. The proportion of soup sales last week in Boston that was sold under the
Would you use a sample or census to measure each of the following? a. The number of workers currently employed by Campbell Soup Company. b. The average price of a can of Campbell’s Cream of Mushroom soup. c. The total earnings of workers employed by Campbell Soup Company last year.
Is each of the following a parameter or a statistic? If you are uncertain, explain the issues. a. The number of cans of Campbell’s soup sold last week at your local supermarket. b. The proportion of all soup in the United States that was sold under the Campbell’s brand last year. c. The
Is each of the following a parameter or statistic? a. The number of visits to a pediatrician’s office last week. b. The number of copies of John Grisham’s most recent novel sold to date. c. The total revenue realized from sales of John Grisham’s most recent novel.
A certain health maintenance organization (HMO) is studying its daily office routine. They collect information on three variables: the number of patients who visit during a day, the patient’s complaint, and the waiting time until each patient sees a doctor. (a) Which variable is categorical? (b)
Arsenic (a naturally occurring, poisonous metal) in home water wells is a common threat. (a) What sampling method would you use to estimate the arsenic levels in wells in a rural county to see whether the samples violate the EPA limit of 10 parts per billion (ppb)? (b) Is a census possible?
Would you expect Noodles & Company to use a sample or census to measure each of the following? Explain. a. The annual average weekly revenue of each Noodles restaurant. b. The average number of weekly lunch visits by customers. c. The customer satisfaction rating of a new dessert. d. The number of
A financial magazine publishes an annual list of major stock funds. Last year, the list contained 1,699 funds. What method would you recommend to obtain a sample of 20 stock funds to estimate the 10-year percent return?
Examine each of the following statistics. Which sampling method was most likely to have been used (simple random, systematic, stratified, cluster)? a. A survey showed that 30 percent of U.S. businesses have fired an employee for inappropriate web surfing, such as gambling, watching porn, or
Which type of data (cross-sectional or time series) is each variable? a. Scores of 50 students on a midterm accounting exam last semester. b. Bob’s scores on 10 weekly accounting quizzes last semester. c. Average score by all takers of the state’s CPA exam for each of the last 10 years. d.
The National Claims History (NCH) contains records for 999,645 Medicare patients who were discharged from acute care hospitals in October 2008. The Department of Health and Human Services performed a detailed audit of adverse medical events on a random sample of 780 drawn at random without
As a statistics project, a student examined every cigarette butt along the sidewalk and curb along one block near his home. Of 47 identifiable butts, 22 were Marlboro. (a) What sampling method is this (if any)? (b) Is it correct to infer that 47 percent of all smokers prefer Marlboro? (c) What
To protect baby scallops and ensure the survival of the species, the U.S. Fisheries and Wildlife Service requires that an average scallop must weigh at least 1/36 pound. The harbormaster at a Massachusetts port randomly selected 18 bags of scallops from 11,000 bags on an arriving vessel. From each
Blood lead levels exceeding 10 micrograms per deciliter have been shown to be harmful to mental and physical development in children. The U.S. Centers for Disease Control and Prevention in Atlanta estimated that about 500,000 children in the United States have blood concentrations of lead higher
Suggest both a Likert scale question and a response scale to measure the following: a. A student’s rating of a particular statistics professor. b. A voter’s satisfaction with the president’s economic policy. c. An HMO patient’s perception of waiting time to see a doctor.
Which type of data (cross-sectional or time series) is each variable? a. Value of Standard & Poor’s 500 stock price index at the close of each trading day last year. b. Closing price of each of the 500 stocks in the S&P 500 index on the last trading day this week. c. Dividends per share paid by
A tabletop survey by a restaurant asked the question shown below. (a) What kind of response scale is this? (b) Suggest an alternative response scale that would be more sensitive to differences in opinion. (c) Suggest possible sources of bias in this type of survey. Were the food and beverage
From the display below pick five cards (without replacement) by using random numbers.Explain your method. Why would the other sampling methods not work well in this case?
Which type of data (cross-sectional or time series) is each variable? a. Mexico’s GDP for each of the last 10 quarters. b. Unemployment rates in each of the 31 states in Mexico at the end of last year. c. Unemployment rate in Mexico at the end of each of the last 10 years. d. Average home value
Which measurement level (nominal, ordinal, interval, ratio) is each of the following variables? Explain. a. Number of hits in Game 1 of the next World Series. b. Baltimore’s standing in the American League East (among five teams). c. Field position of a baseball player (catcher, pitcher,
(a) Make a stem-and-leaf plot for these 24 observations on the number of customers who used a downtown CitiBank ATM during the noon hour on 24 consecutive workdays.(b) Make a dot plot of the ATM data.(c) Describe these two displays.
Below are sorted data showing average spending per customer (in dollars) at 74 Noodles & Company restaurants.(a) Construct a frequency distribution. Explain how you chose the number of bins and the bin limits.(b) Make a histogram and describe its appearance.(c) Repeat, using a larger
(a) Use Excel to prepare a line chart to display the data on housing starts. Modify the default colors, fonts, etc., to make the display effective.(b) Describe the pattern, if any.
(a) Use Excel to prepare a line chart to display the skier/snowboarder data. Modify the default colors, fonts, etc., to make the display effective.(b) Describe the pattern, if any.
(a) Use Excel to prepare a line chart to display the lightning death data. Modify the default colors, fonts, etc., as you judge appropriate to make the display effective.(b) Describe the pattern, if any.
(a) Use Excel to prepare a line chart to display the following transplant data. Modify the default colors, fonts, etc., to make the display effective.(b) Describe the pattern, if any.
(a) Use Excel to prepare a line chart to display the following gasoline price data. Modify the default colors, fonts, etc., to make the display effective.(b) Change it to a 2-D column chart. Modify the display if necessary to make the display attractive.(c) Do you prefer the line chart or bar
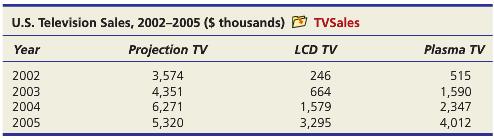
(a) Use Excel to prepare a 2-D stacked column chart for television sales by year. Modify the colors, fonts, etc., to make the display effective.(b) Change your graph to a 3-D stacked column chart. Modify the chart if necessary to make it attractive.(c) Is 3-D better than 2-D? Why?(d)
(a) Use Excel to prepare a Pareto chart of the following data.(b) Which three complaint categories account for approximately 80 percent of all complaints?(c) Which category should the telephone company focus on first?
(a) Use Excel to prepare a 2-D pie chart for these web-surfing data. Modify the default colors, fonts, etc., as you judge appropriate to make the display effective.(b) Right-click the chart area, select Chart Type, and change to an exploded 2-D pie chart.(c) Right-click the chart area, select Chart
(a) Use Excel to prepare a 2-D pie chart for the following data. Modify the default colors, fonts, etc., as you judge appropriate to make the display effective.(b) Right-click the chart area, select Chart Type, and change to a 3-D pie chart.(c) Right-click the chart area, select Chart Type,
(a) Make a stem-and-leaf plot for the number of defects per 100 vehicles for these 32 brands.(b) Make a dot plot of the defects data.(c) Describe these two displays.
(a) Use Excel to prepare a 2-D pie chart for these LCD (liquid crystal display) shipments data. Modify the default colors, fonts, etc., as you judge appropriate to make the display effective.(b) Do you feel that the chart has become too cluttered (i.e., are you displaying too many slices)?
(a) Use Excel to make a scatter plot of the data for bottled water sales for 10 weeks, placing Price on the X-axis and Units Sold on the Y-axis. Add titles and modify the default colors, fonts, etc., as you judge appropriate to make the scatter plot effective.(b) Describe the relationship (if any)
(a) Use Excel to make a scatter plot of these vehicle data, placing Weight on the X-axis and City MPG on the Y-axis. Add titles and modify the default colors, fonts, etc., as you judge appropriate to make the scatter plot effective.(b) Describe the relationship (if any) between X and Y. Weak?
(a) Use Excel to make a scatter plot of the following exam score data, placing Midterm on the X-axis and Final on the Y-axis. Add titles and modify the default colors, fonts, etc., as you judge appropriate to make the scatter plot effective.(b) Describe the relationship (if any) between X and Y.
(a) Use Excel to make a scatter plot of the data, placing Floor Space on the X-axis and Weekly Sales on the Y-axis. Add titles and modify the default colors, fonts, etc., as you judge appropriate to make the scatter plot effective.(b) Describe the relationship (if any) between X and Floor Space Y.
The durations (minutes) of 26 electric power outages in the community of Sonando Heights over the past five years are shown below.(a) Make a stem-and-leaf diagram.(b) Make a histogram.(c) Describe the shape of the distribution.
The U.S. Postal Service will ship a Priority Mail ® Large Flat Rate Box (12" 3 12" 3 5½") anywhere in the United States for a fixed price, regardless of weight. The weights (ounces) of 20 randomly chosen boxes are shown below.(a) Make a stem-and-leaf diagram.(b) Make a histogram.(c) Describe the
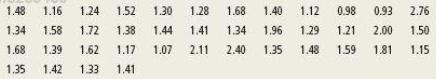
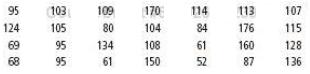
A study of 40 U.S. cardiac care centers showed the following ratios of nurses to beds.(a) Prepare a dot plot.(b) Prepare a frequency distribution and histogram (you may either specify the bins yourself or use automatic bins).(c) Describe the distribution, based on these displays.
The first Rose Bowl (football) was played in 1902. The next was not played until 1916, but a Rose Bowl has been played every year since then. The margin of victory in each of the 95 Rose Bowls from 1902 through 2011 is shown below (0 indicates a tie).(a) Prepare a stem- and-leaf plot.(b) Prepare a
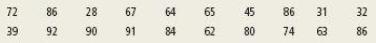
An executive's telephone log showed the following data for the length of 65 calls initiated during the last week of July.(a) Prepare a dot plot.(b) Prepare a frequency distribution and histogram (you may either specify the bins yourself or use automatic bins).(c) Describe the CallLength
Sarah and Bob share a 1,000-minute cell phone calling plan.(a) Make a stacked dot plot to compare the lengths of cell phone calls by Sarah and Bob during the last week.(b) Describe what the dot plots tell you.Sarah’s calls: 1, 1, 1, 1, 2, 3, 3, 3, 5, 5, 6, 6, 7, 8, 8, 12, 14, 14, 22, 23, 29, 33,
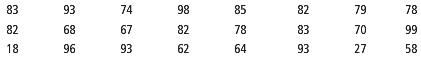
Below are batting averages of the New York Yankees players who were at bat ve times or more in 2006.(a) Construct a frequency distribution. Explain how you chose the number of bins and the bin limits.(b) Make a histogram and describe its appearance.(c) Repeat, using a different number of bins and
Download the full data set of measurements of cockpit noise level for a commercial jet airliner from the OLC (only six data values are shown).(a) Use Excel to make a scatter plot, placing Airspeed on the X-axis and Noise Level on the Y-axis. Add titles and modify the default colors, fonts, etc., as
Download the full data set from the OLC (only six data values are shown).(a) Use Excel to make a scatter plot, placing Revenue on the X-axis and Net Income on the Y-axis. Add titles and modify the default colors, fonts, etc., as you judge appropriate to make the scatter plot effective.(b) Describe
Download the full data set from the OLC (only six data values are shown).(a) Use Excel to make a scatter plot, placing GDP per Capita on the X-axis and Birth Rate on the Y-axis. Add titles and modify the default colors, fonts, etc., as you judge appropriate to make the scatter plot effective.(b)
(a) What kind of display is this?(b) Identify its strengths and weaknesses, using the tips and checklists shown in this chapter.(c) Can you suggest any improvements? Would a different type of display be better?
(a) What kind of display is this?(b) Identify its strengths and weaknesses, using the tips and checklists shown in this chapter.(c) Can you suggest any improvements? Would a different type of display be better?
(a) What kind of display is this?(b) Identify its strengths and weaknesses, using the tips and checklists shown in this chapter.(c) Can you suggest any improvements? Would a different type of display be better?
(a) What kind of display is this?(b) Identify its strengths and weaknesses, using the tips and checklists shown in this chapter.(c) Can you suggest any improvements? Would a different type of display be better?
(a) What kind of display is this?(b) Identify its strengths and weaknesses, using the tips and checklists shown in this chapter.(c) Can you suggest any improvements? Would a different type of display be better?
(a) What kind of display is this?(b) Identify its strengths and weaknesses, using the tips and checklists shown in this chapter.(c) Can you suggest any improvements? Would a different type of display be better?
(a) The table shows the number of days on the market for the 36 recent home sales in the city of Sonando Hills. Construct a frequency distribution and histogram, using nice (round) bin limits.(b) Describe the distribution and note any unusual features.
(a) What kind of display is this?(b) Identify its strengths and weaknesses, using the tips and checklists shown in this chapter.(c) Can you suggest any improvements? Would a different type of display be better?
(a) What kind of display is this?(b) Identify its strengths and weaknesses, using the tips and checklists shown in this chapter.(c) Can you suggest any improvements? Would a different type of display be better?
(a) What kind of display is this?(b) Identify its strengths and weaknesses, using the tips and checklists shown in this chapter.(c) Can you suggest any improvements? Would a different type of display be better?
(a) Use Excel to prepare an appropriate type of chart (bar, line, pie, scatter) to display the following data. Modify the default colors, fonts, etc., as you judge appropriate to make the display effective.(b) Would more than one kind of display be acceptable? Why or why not?
(a) Use Excel to prepare an appropriate type of chart (bar, line, pie, scatter) to display the following data. Modify the default colors, fonts, etc., as you judge appropriate to make the display effective.(b) Would more than one kind of display be acceptable? Why or why not?
(a) Use Excel to prepare an appropriate type of chart (bar, line, pie, scatter) to display the following data. Modify the default colors, fonts, etc., as you judge appropriate to make the display effective.(b) Would more than one kind of display be acceptable? Why or why not?
(a) Use Excel to prepare an appropriate type of chart (bar, line, pie, scatter) to display the following data. Modify the default colors, fonts, etc., as you judge appropriate to make the display effective.(b) Would more than one kind of display be acceptable? Why or why not?
(a) Use Excel to prepare an appropriate type of chart (bar, line, pie, scatter) to display the following data. Modify the default colors, fonts, etc., as you judge appropriate to make the display effective.(b) Would more than one kind of display be acceptable? Why or why not?
(a) Use Excel to prepare an appropriate type of chart (bar, line, pie, scatter) to display the following data. Modify the default colors, fonts, etc., as you judge appropriate to make the display effective.(b) Would more than one kind of display be acceptable? Why or why not?
(a) Use Excel to prepare an appropriate type of chart (bar, line, pie, scatter) to display the following data. Modify the default colors, fonts, etc., as you judge appropriate to make the display effective.(b) Would more than one kind of display be acceptable? Why or why not?
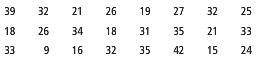
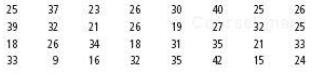
(a) The table shows raw scores on a state civil service exam taken by 24 applicants for positions in law enforcement. Construct a frequency distribution and histogram, using nice (round) bin limits.(b) Describe the distribution and note any unusual features.
(a) Use Excel to prepare an appropriate type of chart (bar, line, pie, scatter) to display the following data. Modify the default colors, fonts, etc., as you judge appropriate to make the display effective.(b) Would more than one kind of display be acceptable? Why or why not?
(a) Use Excel to prepare a Pareto chart of the following data.(b) Which three service providers account for approximately 80 percent of all responses?
(a) Make a frequency distribution and histogram (using appropriate bins) for these 28 observations on the amount spent for dinner for four in downtown Chicago on Friday night.(b) Repeat the exercise, using a different number of bins. Which is preferred? Why?
(a) Make a frequency distribution and histogram for the monthly off-campus rent paid by 30 students.(b) Repeat the exercise, using a different number of bins. Which is preferred? Why?
(a) Make a frequency distribution and histogram for the 2007 annual compensation of 40 randomly chosen CEOs (millions of dollars).(b) Describe the shape of the histogram.(c) Identify any unusual values.
For each frequency distribution, suggest “nice” bins. Did your choice agree with Sturges’ Rule? If not, explain.a. Last week’s MPG for 35 student vehicles (xmin 5 9.4, xmax 5 38.7).b. Ages of 50 airplane passengers (xmin 5 12, xmax 5 85).c. GPAs of 250 first-semester college students (xmin
(a) For each data set, find the mean, median, and mode. (b) Discuss anything about the data that affects the usefulness of each statistic as a measure of center. a. Class absences (12 students): 0, 0, 0, 0, 0, 1, 2, 3, 3, 5, 5, 15 b. Exam scores (9 students): 40, 40, 65, 71, 72, 75, 76, 78, 98 c.
(a) For each data set, find the median, midrange, and geometric mean. (b) Are they reason- able measures of central tendency? Explain. a. Exam scores (9 students) 42, 55, 65, 67, 68, 75, 76, 78, 94 b. GPAs (8 students) 2.25, 2.55, 2.95, 3.02, 3.04, 3.37, 3.51, 3.66 c. Class absences (12
(a) Write the Excel function for the 10 percent trimmed mean of a data set in cells A1:A50.(b) How many observations would be trimmed in each tail?(c) How many would be trimmed overall?
In the Excel function 5 TRIMMEAN (Data,.10) , how many observations would be trimmed from each end of the sorted data array named Data if (a) n = 41, (b) n = 66, and (c) n = 83?
The city of Sonando Hills has 8 police of officers. In January, the work-related medical expenses for each of officer were 0, 0, 0, 0, 0, 0, 150, 650. (a) Calculate the mean, median, mode, midrange, and geometric mean. (b) Which measure of center would you use to budget the expected medical
Spirit Airlines kept track of the number of empty seats on fight 308 (DENDTW) for 10 consecutive trips on each weekday except Friday.(a) Sort the data for each day.(b) Find the mean, median, mode, midrange, geometric mean, and 10 percent trimmed mean (i.e., dropping the first and last sorted
CitiBank recorded the number of customers to use a downtown ATM during the noon hour on 32 consecutive workdays.(a) Find the mean, midrange, geometric mean, and 10 percent trimmed mean.(b) Do these measures of center agree? Explain.
On Friday night, the owner of Chez Pierre in downtown Chicago noted the amount spent for dinner at 28 four-person tables.(a) Find the mean, midrange, geometric mean, and 10 percent trimmed mean.(b) Do these measures of center agree? Explain.
An executive's telephone log showed the lengths of 65 calls initiated during the last week of July.(a) Find the mean, median, mode, midrange, geometric mean, and 10 percent trimmed mean.(b) Are the data symmetric or skewed? If skewed, which direction?
The number of Internet users in Latin America grew from 78.5 million in 2000 to 156.6 million in 2010. Use the geometric mean to find the annual growth rate.
(a) Find the mean and standard deviation for each sample.(b) What does this exercise show about the standard deviation?Sample A: 6, 7, 8Sample B: 61, 62, 63Sample C: 1000, 1001, 1002
For each data set, is the mode a good measure of center? Explain. a. Genders of 12 CEOs: M, M, F, M, F, M, M, M, F, M, M, M b. Ages of 10 college freshmen: 17, 17, 18, 18, 18, 18, 18, 18, 19, 20 c. Ages of 8 MBA students: 24, 26, 27, 28, 30, 31, 33, 37
For each data set:(a) Find the mean.(b) Find the standard deviation, treating the data as a sample.(c) Find the standard deviation, treating the data as a population.(d) What does this exercise show about the two formulas?Data Set A: 6, 7, 8Data Set B: 4, 5, 6, 7, 8, 9, 10Data Set C: 1, 2, 3, 4, 5,
In fuel economy tests in city driving conditions, a hybrid vehicle's mean was 43.2 mpg with a standard deviation of 2.2 mpg. A comparably sized gasoline vehicle's mean was 27.2 mpg with a standard deviation of 1.9 mpg. Which vehicle's mpg was more consistent in relative terms?
Find the mean absolute deviation (MAD) of these five numbers: 12, 18, 21, 22, 27.
Showing 25500 - 25600
of 88243
First
249
250
251
252
253
254
255
256
257
258
259
260
261
262
263
Last
Step by Step Answers
.png)
.png)
.png)
.png)
.png)
.png)
.png)
.png)
.png)
.png)
.png)
.png)
.png)
.png)
.png)
.png)
.png)
.png)
.png)
.png)
.png)
.png)
.png)
.png)
.png)
.png)
.png)
.png)
.png)
.png)
.png)
.png)
.png)
.png)
.png)
.png)
.png)
.png)
.png)
.png)
.png)
.png)
.png)
.png)
.png)
.png)

