New Semester
Started
Get
50% OFF
Study Help!
--h --m --s
Claim Now
Question Answers
Textbooks
Find textbooks, questions and answers
Oops, something went wrong!
Change your search query and then try again
S
Books
FREE
Study Help
Expert Questions
Accounting
General Management
Mathematics
Finance
Organizational Behaviour
Law
Physics
Operating System
Management Leadership
Sociology
Programming
Marketing
Database
Computer Network
Economics
Textbooks Solutions
Accounting
Managerial Accounting
Management Leadership
Cost Accounting
Statistics
Business Law
Corporate Finance
Finance
Economics
Auditing
Tutors
Online Tutors
Find a Tutor
Hire a Tutor
Become a Tutor
AI Tutor
AI Study Planner
NEW
Sell Books
Search
Search
Sign In
Register
study help
mathematics
statistics
Statistics The Exploration & Analysis Of Data 7th Edition Roxy Peck, Jay L. Devore - Solutions
The article “Americans on the Move” (USA Today, November 30, 2007) included the data in the accompanying table. Entries in the table are the percentage of state residents who had moved during 2006. Construct a histogram of these data using class intervals of 10 to = 12, 12 to = 14, 14 to = 16,
The accompanying data on annual maximum wind speed (in meters per second) in Hong Kong for each year in a 45-year period were given in an article that appeared in the journal Renewable Energy (March, 2007). Use the annual maximum wind speed data to construct a histogram. Is the histogram
The accompanying relative frequency table is based on data from the 2007 College Bound Seniors Report for California (College Board, 2008).a. Construct a relative frequency histogram for SAT reasoning score for males.b. Construct a relative frequency histogram for SAT reasoning score for females.c.
The data in the accompanying table represents the percentage of workers who are members of a union for each U.S. state and the District of Columbia (AARP Bulletin, September 2009). a. Construct a histogram of these data using class intervals of 0 to _5, 5 to _10, 10 to _15, 15 to _20, and 20 to
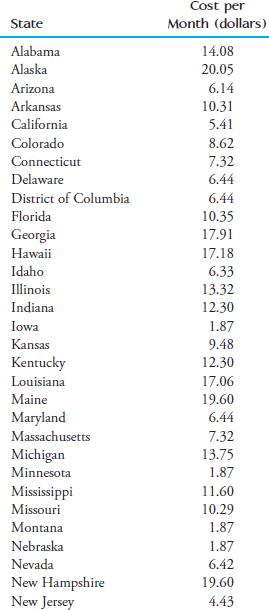
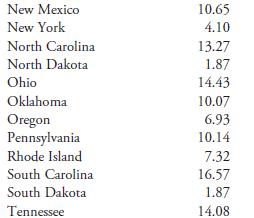
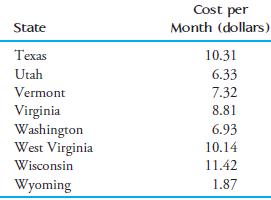
Medicare’s new medical plans offer a wide range of variations and choices for seniors when picking a drug plan (San Luis Obispo Tribune, November 25, 2005). The monthly cost for a stand-alone drug plan varies from plan to plan and from state to state. The
The following two relative frequency distributions were constructed using data that appeared in the report €œUndergraduate Students and Credit Cards in 2004€ (Nellie Mae, May 2005). One relative frequency distribution is based on credit bureau data for a random sample of 1413 college
U.S. Census data for San Luis Obispo County, California, were used to construct the following frequency distribution for commute time (in minutes) of working adults (the given frequencies were read from a graph that appeared in the San Luis Obispo Tribune [Sep tem ber 1, 2002] and so are only
Student loans can add up, especially for those attending professional schools to study in such areas as medicine, law, or dentistry. Researchers at the University of Washington studied medical students and gave the following information on the educational debt of medical students on completion of
The survey referenced in the previous exercise was conducted by Robert Half Technology. This company issued a press release (€œWhistle€”But Don€™t Tweet€” While You Work,€ www.roberthalftechnology.com, October 6, 2009) that provided more detail than in the USA Today snapshot
An exam is given to students in an introductory statistics course. What is likely to be true of the shape of the histogram of scores if:a. the exam is quite easy?b. the exam is quite difficult?c. half the students in the class have had calculus, the other half have had no prior college math
The accompanying frequency distribution summarizes data on the number of times smokers who had successfully quit smoking attempted to quit before their final successful attempt (€œDemographic Variables, Smoking Variables, and Outcome Across Five Studies,€ Health Psychology [2007]:
Example 3.19 used annual rainfall data for Albuquerque, New Mexico, to construct a relative frequency distribution and cumulative relative frequency plot. The National Climate Data Center also gave the accompanying annual rainfall (in inches) for Medford, Oregon, from 1950 to 2008.a. Construct a
The authors of the paper €œMyeloma in Patients Younger than Age 50 Years Presents with More Favorable Features and Shows Better Survival€ (Blood [2008]: 4039€“4047) studied patients who had been diagnosed with stage 2 multiple myeloma prior to the age of 50. For each patient who received
a. Use the cumulative relative frequencies given in the previous exercise to compute the relative frequencies for each class interval and construct a relative frequency distribution.b. Summarize the survival time data with a histogram.c. Based on the histogram, write a few sentences describing
Construct a histogram corresponding to each of the five frequency distributions, I€“ V, given in the following table, and state whether each histogram is symmetric, bimodal, positively skewed, or negatively skewed:
Using the five class intervals 100 to 120, 120 to 140, . . . , 180 to 200, devise a frequency distribution based on 70 observations whose histogram could be described as follows:a. symmetricc. positively skewedb. bimodald. negatively skewed
Consumer Reports Health (www.consumer reports.org) gave the accompanying data on saturated fat (in grams), sodium (in mg), and calories for 36 fast-food items.a. Construct a scatterplot using y = calories and x = fat. Does it look like there is a relationship between fat and calories? Is the
The report €œWireless Substitution: Early Release of Estimates from the National Health Interview Survey€ (Center for Disease Control, 2009) gave the following estimates of the percentage of homes in the United States that had only wireless phone service at 6-month intervals
The National Confectioners Association asked 1006 adults the following question: “Do you set aside a personal stash of Halloween candy?” Fifty-five percent of those surveyed responded no, 41% responded yes, and 4% either did not answer the question or said they did not know (USA Today, October
The accompanying table gives the cost and an overall quality rating for 15 different brands of bike helmets (www.consumerreports.org).a. Construct a scatterplot using y = quality rating and x = cost.b. Based on the scatterplot from Part (a), does there appear to be a relationship between cost and
The accompanying table gives the cost and an overall quality rating for 10 different brands of men€™s athletic shoes and nine different brands of women€™s athletic shoes(www.consumerreports.org).a. Using the data for all 19 shoes, construct a scatterplot using y = quality rating and x =
The article €œMedicine Cabinet is a Big Killer€ (The Salt Lake Tribune, August 1, 2007) looked at the number of prescription-drug-overdose deaths in Utah over the period from 1991 to 2006. Construct a time series plot for these data and describe the trend over time. Has the
The article €œCities Trying to Rejuvenate Recycling Efforts€ (USA Today, October 27, 2006) states that the amount of waste collected for recycling has grown slowly in recent years. This statement was supported by the data in the accompanying table. Use these data to construct a time-series
Some days of the week are more dangerous than others, according to Traffic Safety Facts produced by the National Highway Traffic Safety Administration. The average number of fatalities per day for each day of the week are shown in the accompanying table.a. Using the midpoint of each year range
The accompanying time-series plot of movie box office totals (in millions of dollars) over 18 weeks of summer for both 2001 and 2002 appeared in USA Today (September 3, 2002): Patterns that tend to repeat on a regular basis over time are called seasonal patterns. Describe any seasonal patterns that
The accompanying comparative bar chart is from the report €œMore and More Teens on Cell Phones€ (Pew Research Center, www.pewresearch.org, August 19, 2009). Suppose that you plan to include this graph in an article that you are writing for your school newspaper. Write a few
Figure EX-3.47 is from the Fall 2008 Census Enrollment Report at Cal Poly, San Luis Obispo. It uses both a pie chart and a segmented bar graph to summarize data on ethnicity for students enrolled at the university in Fall 2008.a. Use the information in the graphical display to construct a single
The accompanying graph appeared in USA Today (August 5, 2008). This graph is a modified comparative bar graph. Most likely, the modifications (incorporating hands and the earth) were made to try to make a display that readers would find more interesting.a. Use the information in the USA Today graph
The two graphical displays below appeared in USA Today (June 8, 2009 and July 28, 2009). One is an appropriate representation and the other is not. For each of the two, explain why it is or is not drawn appropriately.
The report €œCommunicating to Teens (Aged 12€“17)€ (U.S. Department of Health and Human Services, www.cdc.gov) suggests that teens can be classified into five groups based on attitude, behavior, and conformity. The report also includes estimates of the percentage of teens who fall into
The following graphical display is meant to be a comparative bar graph (USA Today, August 3, 2009). Do you think that this graphical display is an effective summary of the data? If so, explain why. If not, explain why not and construct a display that makes it easier to compare the ice cream
The article €œMost Smokers Wish They Could Quit€ (Gallup Poll Analyses, November 21, 2002) noted that smokers and nonsmokers perceive the risks of smoking differently. The accompanying relative frequency table summarizes responses regarding the perceived harm of smoking for each of three
Each year the College Board publishes a profile of students taking the SAT. In the report €œ2005 College Bound Seniors: Total Group Profile Report,€ the average SAT scores were reported for three groups de fined by first language learned. Use the data in the accompanying table
The report referenced in Exercise 3.53 also gave average math SAT scores for the three language groups, as shown in the following table..Construct a comparative bar chart for the average verbal and math scores for the three language groups. Write a few sentences describing the differences and
The Connecticut Agricultural Experiment Station conducted a study of the calorie content of different types of beer. The calorie content (calories per 100 ml) for 26 brands of light beer are (from the web site brewery.org): 29 28 33 31 30 33 30 28 27 41 39 31 29 23 32 31 32 19 40 22 34 31 42 35 29
The stem-and-leaf display of Exercise 3.16 uses only four stems. Construct a stem-and-leaf display for these data using repeated stems 1H, 2L, 2H 4L. For example, the first observation, 29, would have a stem of 2 and a leaf of 9. It would be entered into the display for the stem 2H, because it is a
The article “A Nation Ablaze with Change” (USA Today, July 3, 2001) gave the accompanying data on percentage increase in population between 1990 and 2000 for the 50 U.S. states. Also provided in the table is a column that indicates for each state whether the state is in the eastern or western
People suffering from Alzheimer€™s disease often have dif fi culty performing basic activities of daily living (ADLs). In one study (€œFunctional Status and Clinical Findings in Patients with Alzheimer€™s Disease,€ Journal of Gerontology [1992]: 177€“ 182), investigators focused
Does the size of a transplanted organ matter? A study that attempted to answer this question (€œMinimum Graft Size for Successful Living Donor Liver Transplantation,€ Transplantation [1999]:1112€“ 1116) presented a scatterplot much like the following (€œgraft weight ratio€ is the
The Center for Science in the Public Interest evaluated school cafeterias in 20 school districts across the United States. Each district was assigned a numerical score on the basis of rigor of food codes, frequency of food safety inspections, access to inspection information, and the results of
The National Telecommunications and Information Administration published a report titled €œFalling Through the Net: Toward Digital Inclusion€ (U.S. Department of Commerce, October 2000) that included the following information on access to computers in the home:a. Construct a time-series plot
According to the National Association of Home Builders, the average size of a home in 1950 was 983 ft2. The average size increased to 1500 ft2 in 1970, 2080 ft2 in 1990; and 2330 ft2 in 2003 (San Luis Obispo Tribune, October 16, 2005).a. Construct a time-series plot that shows how the average size
The paper “Community Colleges Start to Ask, Where Are the Men?” (Chronicle of Higher Education, June 28, 2002) gave data on gender for community college students. It was reported that 42% of students enrolled at community colleges nationwide were male and 58% were female. Construct a segmented
The article €œTobacco and Alcohol Use in G-Rated Children€™s Animated Films€ (Journal of the American Medical Association [1999]: 1131€“ 1136) reported exposure to tobacco and alcohol use in all G-rated animated films released between 1937 and 1997 by five major film studios. The
The accompanying data on household expenditures on transportation for the United Kingdom appeared in €œTransport Statistics for Great Britain: 2002 Edition€ (in Family Spending: A Report on the Family Expenditure Survey [The Stationary Office, 2002]). Expenditures (in pounds per week)
a. Summarize these data using a pie chart.b. Construct a segmented bar graph for these data.c. Which graphing method€”the pie chart or the segmented bar graph€”do you think does a better job of conveying information about response? Explain.
€œIf you were taking a new job and had your choice of a boss, would you prefer to work for a man or a woman?€ That was the question posed to individuals in a sample of 576 employed adults (Gallup at a Glance, October 16, 2002). Responses are summarized in the following table:a. Construct a
2005 was a record year for hurricane devastation in the United States (San Luis Obispo Tribune, November 30, 2005). Of the 26 tropical storms and hurricanes in the season, four hurricanes hit the mainland: Dennis, Katrina, Rita, and Wilma. The United States insured catastrophic losses since 1989
An article in the San Luis Obispo Tribune (November 20, 2002) stated that 39% of those with critical housing needs (those who pay more than half their income for housing) lived in urban areas, 42% lived in suburban areas, and the rest lived in rural areas. Construct a pie chart that shows the
Living-donor kidney transplants are becoming more common. Often a living donor has chosen to donate a kidney to a relative with kidney disease. The following data appeared in a USA Today article on organ transplants (€œKindness Motivates Newest Kidney Donors,€ June 19, 2002):a. Construct a
The article €œHousework around the World€ (USA Today, September 15, 2009) included the percentage of women who say their spouses never help with household chores for five different countries.a. Display the information in the accompanying table in a bar chart.b. The article did not state how
Many nutritional experts have expressed concern about the high levels of sodium in prepared foods. The following data on sodium content (in milligrams) per frozen meal appeared in the article €œComparison of €˜Light€™ Frozen Meals€ (Boston Globe, April 24, 1991):Two histograms for
Americium 241 (241Am) is a radioactive material used in the manufacture of smoke detectors. The article €œRetention and Dosimetry of Injected 241Am in Beagles€ (Radiation Research [1984]: 564€“ 575) described a study in which 55 beagles were injected with a dose of 241Am (proportional to
The report €œFindings from the 2008 Administration of the College Senior Survey€ (Higher Education Research Institute, 2009) asked a large number of college seniors how they would rate themselves compared to the average person of their age with respect to physical health. The accompanying
The article “Rinse Out Your Mouth” (Associated Press, March 29, 2006) summarized results from a survey of 1001 adults on the use of profanity. When asked “How many times do you use swear words in conversations?” 46% responded a few or more times per week, 32% responded a few times a month
The Insurance Institute for Highway Safety (www.iihs.org, June 11, 2009) published data on repair costs for cars involved in different types of accidents. In one study, seven different 2009 models of mini- and micro-cars were driven at 6 mph straight into a fixed barrier. The following table gives
The ministry of Health and Long-Term Care in Ontario, Canada, publishes information on its web site (www.health.gov.on.ca) on the time that patients must wait for various medical procedures. For two cardiac procedures completed in fall of 2005, the following information was provided:a. The median
Houses in California are expensive, especially on the Central Coast where the air is clear, the ocean is blue, and the scenery is stunning. The median home price in San Luis Obispo County reached a new high in July 2004, soaring to $452,272 from $387,120 in March 2004. (San Luis Obispo Tribune,
Consider the following statement: More than 65% of the residents of Los Angeles earn less than the average wage for that city. Could this statement be correct? If so, how? If not, why not?
Suppose that 10 patients with meningitis received treatment with large doses of penicillin. Three days later, temperatures were recorded, and the treatment was considered successful if there had been a reduction in a patient€™s temperature. Denoting success by S and failure by F, the 10
An experiment to study the lifetime (in hours) for a certain brand of light bulb involved putting 10 light bulbs into operation and observing them for 1000 hours. Eight of the light bulbs failed during that period, and those lifetimes were recorded. The lifetimes of the two light bulbs still
An instructor has graded 19 exam papers submitted by students in a class of 20 students, and the average so far is 70. (The maximum possible score is 100.) How high would the score on the last paper have to be to raise the class average by 1 point? By 2 points?
The following data are cost (in cents) per ounce for nine different brands of sliced Swiss cheese (www.consumerreports.org):a. Compute the variance and standard deviation for this data set. s2 5 279.111; s5 16.707b. If a very expensive cheese with a cost per slice of 150 cents was added to the data
Cost per serving (in cents) for six high-fiber cereals rated very good and for nine high-fiber cereals rated good by Consumer Reports are shown below. Write a few sentences describing how these two data sets differ with respect to center and variability. Use summary statistics to support your
Combining the cost-per-serving data for highfiber cereals rated very good and those rated good from the previous exercise gives the following data set:a. Compute the quartiles and the interquartile range for this combined data set.b. Compute the interquartile range for just the cereals rated good.
The article €œCaffeinated Energy Drinks€”A Growing Problem€ (Drug and Alcohol Dependence [2009]: 1€“10) gave the following data on caffeine concentration (mg/ounce) for eight top-selling energy drinks:a. What is the value of the mean caffeine concentration for this set of top-selling
The paper €œCaffeinated Energy Drinks€”A Growing Problem€ (Drug and Alcohol Dependence [2009]: 1€“10) gave the accompanying data on caffeine per ounce for eight top-selling energy drinks and for 11 high-caffeine energy drinks:The mean caffeine per ounce is clearly higher for the high
The Insurance Institute for Highway Safety (www.iihs.org, June 11, 2009) published data on repair costs for cars involved in different types of accidents. In one study, seven different 2009 models of mini- and micro-cars were driven at 6 mph straight into a fixed barrier. The following table gives
Consumer Reports Health (www.consumer reports.org/health) reported the accompanying caffeine concentration (mg/cup) for 12 brands of coffee:Compute the values of the quartiles and the interquartile range for this data set.
The accompanying data on number of minutes used for cell phone calls in 1 month was generated to be consistent with summary statistics published in a report of a marketing study of San Diego residents (TeleTruth, March 2009):a. Compute the values of the quartiles and the interquartile range for
The article “Rethink Diversification to Raise Returns, Cut Risk” (San Luis Obispo Tribune, January 21, 2006) included the following paragraph: In their research, Mulvey and Reilly compared the results of two hypothetical portfolios and used actual data from 1994 to 2004 to see what returns they
The U.S. Department of Transportation reported the accompanying data (see next page) on the number of speeding-related crash fatalities during holiday periods for the years from 1994 to 2003 (Traffic Safety Facts, July 20, 2005).a. Compute the standard deviation for the New Year€™s Day data.b.
The Ministry of Health and Long-Term Care in Ontario, Canada, publishes information on the time that patients must wait for various medical procedures on its web site (www.health.gov.on.ca). For two cardiac procedures completed in fall of 2005, the following information was provided:a. Which of the
The accompanying table shows the low price, the high price, and the average price of homes sold in 15 communities in San Luis Obispo County between January 1, 2004, and Au gust 1, 2004 (San Luis Obispo Tribune, Sep tem ber 5, 2004):a. Explain why the average price for the combined areas of Los Osos
Consumer Reports Health (www.consumer reports.org/health) reported the accompanying caffeine concentration (mg/cup) for 12 brands of coffee:Use at least one measure of center to compare caffeine concentration for coffee with that of the energy drinks of the previous exercise.
In 1997, a woman sued a computer keyboard manufacturer, charging that her repetitive stress injuries were caused by the keyboard (Genessey v. Digital Equipment Corporation). The jury awarded about $3.5 million for pain and suffering, but the court then set aside that award as being unreasonable
The standard deviation alone does not measure relative variation. For example, a standard deviation of $1 would be considered large if it is describing the variability from store to store in the price of an ice cube tray. On the other hand, a standard deviation of $1 would be considered small if it
Based on a large national sample of working adults, the U.S. Census Bureau reports the following information on travel time to work for those who do not work at home: lower quartile 7 minutes median 18 minutes upper quartile 31 minutes Also given was the mean travel time, which was reported as 22.4
The report €œWho Moves? Who Stays Put? Where€™s Home?€ (Pew Social and Demographic Trends, December 17, 2008) gave the accompanying data for the 50 U.S. states on the percentage of the population that was born in the state and is still living there. The data values
The National Climate Data Center gave the accompanying annual rainfall (in inches) for Medford, Oregon, from 1950 to 2008 (www.ncdc.noaa.gov/oa/ climate/research/cag3/city.html):a. Compute the quartiles and the interquartile range. b. Are there outliers in this data set? If so, which observations
The accompanying data on annual maximum wind speed (in meters per second) in Hong Kong for each year in a 45-year period were given in an article that appeared in the journal Renewable Energy (March 2007). Use the annual maximum wind speed data to construct a boxplot. Is the boxplot approximately
Fiber content (in grams per serving) and sugar content (in grams per serving) for 18 high fiber cereals (www.consumerreports.com) are shown below.a. Find the median, quartiles, and interquartile range for the fiber content data set. b. Find the median, quartiles, and interquartile range for the
Shown here are the number of auto accidents per year for every 1000 people in each of 40 occupations (Knight Ridder Tribune, June 19, 2004):a. Would you recommend using the standard deviation or the iqr as a measure of variability for this data set? b. Are there outliers in this data set? If so,
The average playing time of compact discs in a large collection is 35 minutes, and the standard deviation is 5 minutes. a. What value is 1 standard deviation above the mean? 1 standard deviation below the mean? What values are 2 standard deviations away from the mean? b. Without assuming anything
In a study investigating the effect of car speed on accident severity, 5000 reports of fatal automobile accidents were examined, and the vehicle speed at impact was recorded for each one. For these 5000 accidents, the average speed was 42 mph and the standard deviation was 15 mph. A histogram
Consumer Reports Health (www.consumerreports.org/health) reported the sodium content (mg) per 2 tablespoon serving for each of 11 different peanut butters:a. Display these data using a dotplot. Comment on any unusual features of the plot. b. Compute the mean and median sodium content for the peanut
The U.S. Census Bureau (2000 census) reported the following relative frequency distribution for travel time to work for a large sample of adults who did not work at home:a. Draw the histogram for the travel time distribution. In constructing the histogram, assume that the last interval in the
Mobile homes are tightly constructed for energy conservation. This can lead to a buildup of indoor pollutants. The paper “A Survey of Nitrogen Dioxide Levels Inside Mobile Homes” (Journal of the Air Pollution Control Association [1988]: 647– 651) discussed various aspects of NO2 concentration
The article “Taxable Wealth and Alcoholic Beverage Consumption in the United States” (Psychological Reports [1994]: 813–814) reported that the mean annual adult consumption of wine was 3.15 gallons and that the standard deviation was 6.09 gallons. Would you use the Empirical Rule to
A student took two national aptitude tests. The national average and standard deviation were 475 and 100, respectively, for the first test and 30 and 8, respectively, for the second test. The student scored 625 on the first test and 45 on the second test. Use z scores to determine on which exam the
A sample of concrete specimens of a certain type is selected, and the compressive strength of each specimen is determined. The mean and standard deviation are calculated as x 5 3000 and s 5 500, and the sample histogram is found to be well approximated by a normal curve. a. Approximately what
The paper €œModeling and Measurements of Bus Service Reliability€ (Transportation Research [1978]: 253€“ 256) studied various aspects of bus service and presented data on travel times (in minutes) from several different routes. The accompanying frequency distribution is for bus travel
An advertisement for the “30 inch Wonder” that appeared in the September 1983 issue of the journal Packaging claimed that the 30 inch Wonder weighs cases and bags up to 110 pounds and provides accuracy to within 0.25 ounce. Suppose that a 50 ounce weight was repeatedly weighed on this scale and
Suppose that your statistics professor returned your first midterm exam with only a z score written on it. She also told you that a histogram of the scores was approximately normal. How would you interpret each of the following z scores?
The paper “Answer Changing on Multiple- Choice Tests” (Journal of Experimental Education [1980]: 18– 21) reported that for a group of 162 college students, the average number of responses changed from the correct answer to an incorrect answer on a test containing 80 multiple-choice items was
The average reading speed of students completing a speed-reading course is 450 words per minute (wpm). If the standard deviation is 70 wpm, find the z score associated with each of the following reading speeds. a. 320 wpm c. 420 wpm b. 475 wpm d. 610 wpm
The following data values are 2009 per capita expenditures on public libraries for each of the 50 U.S. states (from www.statemaster.com):a. Summarize this data set with a frequency distribution. Construct the corresponding histogram.b. Use the histogram in Part (a) to find approximate values of the
The accompanying table gives the mean and standard deviation of reaction times (in seconds) for each of two different stimuli:If your reaction time is 4.2 seconds for the first stimulus and 1.8 seconds for the second stimulus, to which stimulus are you reacting (compared to other individuals)
The authors of the paper “Delayed Time to Defibrillation after In-Hospital Cardiac Arrest” (New England Journal of Medicine [2008]: 9–16) described a study of how survival is related to the length of time it takes from the time of a heart attack to the administration of defibrillation
The paper “Portable Social Groups: Willingness to Communicate, Interpersonal Communication Gratifications, and Cell Phone Use among Young Adults” (International Journal of Mobile Communications [2007]: 139–156) describes a study of young adult cell phone use patterns. a. Comment on the
Showing 33500 - 33600
of 88243
First
329
330
331
332
333
334
335
336
337
338
339
340
341
342
343
Last
Step by Step Answers
.png)
.png)
.png)
.png)
.png)
.png)
.png)
.png)
.png)
.png)
.png)
.png)
.png)
.png)
.png)
.png)
.png)
.png)
.png)
.png)
.png)
.png)
.png)
.png)
.png)
.png)
.png)
.png)
.png)
.png)
-1.png)
-2.png)
.png)
.png)
.png)
.png)
.png)
.png)
.png)
-1.png)
-2.png)
.png)
.png)
.png)
.png)
.png)
.png)
.png)
.png)
.png)
.png)
.png)
.png)
-1.png)
.png)
.png)
.png)
.png)

