New Semester
Started
Get
50% OFF
Study Help!
--h --m --s
Claim Now
Question Answers
Textbooks
Find textbooks, questions and answers
Oops, something went wrong!
Change your search query and then try again
S
Books
FREE
Study Help
Expert Questions
Accounting
General Management
Mathematics
Finance
Organizational Behaviour
Law
Physics
Operating System
Management Leadership
Sociology
Programming
Marketing
Database
Computer Network
Economics
Textbooks Solutions
Accounting
Managerial Accounting
Management Leadership
Cost Accounting
Statistics
Business Law
Corporate Finance
Finance
Economics
Auditing
Tutors
Online Tutors
Find a Tutor
Hire a Tutor
Become a Tutor
AI Tutor
AI Study Planner
NEW
Sell Books
Search
Search
Sign In
Register
study help
mathematics
statistics
Statistics The Exploration & Analysis Of Data 7th Edition Roxy Peck, Jay L. Devore - Solutions
The 2006 Expedia Vacation Deprivation Survey (Ipsos Insight, May 18, 2006) described the results of a poll of working adults in Canada. Each person in a random sample was classified according to gender and the number of vacation days he or she usually took each year. The resulting data are
A survey was conducted in the San Francisco Bay area in which each participating individual was classified according to the type of vehicle used most often and city of residence. A subset of the resulting data are given in the accompanying table (The Relationship of Vehicle Type Choice to
Packages of mixed nuts made by a certain company contain four types of nuts. The percentages of nuts of Types 1, 2, 3, and 4 are supposed to be 40%, 30%, 20%, and 10%, respectively. A random sample of nuts is selected, and each one is categorized by type. a. If the sample size is 200 and the
A story describing a date rape was read by 352 high school students. To investigate the effect of the victim€™s clothing on subject€™s judgment of the situation described, the story was accompanied by either a photograph of the victim dressed provocatively, a photo of the victim
Can people tell the difference between a female nose and a male nose? This important (?) research question was examined in the article €œYou Can Tell by the Nose: Judging Sex from an Isolated Facial Feature€ (Perception [1995]: 969€“973). Eight Caucasian males and
The following passage is from the paper €œGender Differences in Food Selections of Students at a Historically Black College and University€ (College Student Journal [2009]: 800€“806): Also significant was the proportion of males and their water consumption (8 oz.
The press release titled €œNap Time€ (pewresearch.org, July 2009) described results from a nationally representative survey of 1488 adult Americans. The survey asked several demographic questions (such as gender, age, and income) and also included a question asking respondents
Each observation in a random sample of 100 bicycle accidents resulting in death was classified according to the day of the week on which the accident occurred. Data consistent with information given on the web site www.highwaysafety.com are given in the following tableBased on these data, is it
The color vision of birds plays a role in their foraging behavior: Birds use color to select and avoid certain types of food. The authors of the article €œColour Avoidance in Northern Bobwhites: Effects of Age, Sex, and Previous Experience€ (Animal Behaviour [1995]:
In November 2005, an international study to assess public opinion on the treatment of suspected terrorists was conducted (€œMost in U.S., Britain, S. Korea and France Say Torture Is OK in at Least Rare Instances,€ Associated Press, December 7, 2005). Each individual in random
According to Census Bureau data, in 1998 the California population consisted of 50.7% whites, 6.6% blacks, 30.6% Hispanics, 10.8% Asians, and 1.3% other ethnic groups. Suppose that a random sample of 1000 students graduating from California colleges and universities in 1998 resulted in the
Criminologists have long debated whether there is a relationship between weather and violent crime. The author of the article €œIs There a Season for Homicide?€ (Criminology [1988]: 287€“296) classified 1361 homicides according to season, resulting in the accompanying
The article €œIn Bronx, Hitting Home Runs Is A Breeze€ (USA Today, June 2, 2009) included a classification of 87 home runs hit at the new Yankee Stadium according to direction that the ball was hit, resulting in the accompanying data.a. Assuming that it is reasonable to regard
Each boy in a sample of Mexican American males, age 10 to 18, was classified according to smoking status and response to a question asking whether he likes to do risky things. The following table is based on data given in the article €œThe Association Between Smoking and Unhealthy
The article €œCooperative Hunting in Lions: The Role of the Individual€ (Behavioral Ecology and Sociobiology [1992]: 445€“454) discusses the different roles taken by lionesses as they attack and capture prey. The authors were interested in the effect of the position
The authors of the article €œA Survey of Parent Attitudes and Practices Regarding Underage Drinking€ (Journal of Youth and Adolescence [1995]: 315€“334) conducted a telephone survey of parents with preteen and teenage children. One of the questions asked was
The article €œRegional Differences in Attitudes Toward Corporal Punishment€ (Journal of Marriage and Family [1994]: 314€“324) presents data resulting from a random sample of 978 adults. Each individual in the sample was asked whether he or she agreed with the
Jail inmates can be classified into one of the following four categories according to the type of crime committed: violent crime, crime against property, drug offenses, and public-order offenses. Suppose that random samples of 500 male inmates and 500 female inmates are selected, and each inmate is
Drivers born under the astrological sign of Capricorn are the worst drivers in Australia, according to an article that appeared in the Australian newspaper The Mercury (October 26, 1998). This statement was based on a study of insurance claims that resulted in the following data for male
The authors of the paper €œRacial Stereotypes in Children€™s Television Commercials€ (Journal of Advertising Research [2008]: 80€“93) counted the number of times that characters of different ethnicities appeared in commercials aired on Philadelphia
The paper €œSociochemosensory and Emotional Functions€ (Psychological Science [2009]: 1118€“1124) describes an interesting experiment to determine if college students can identify their roommates by smell. Forty-four female college students participated as subjects in the experiment.
The paper €œCigarette Tar Yields in Relation to Mortality from Lung Cancer in the Cancer Prevention Study II Prospective Cohort€ (British Medical Journal [2004]: 72€“79) included the accompanying data on the tar level of cigarettes smoked for a sample of male smokers
The paper referenced in the previous exercise also gave the accompanying data on the age at which smoking started for a sample of 1031 men who smoked low-tar cigarettes.a. Use a chi-square goodness-of-fit test to test the null hypothesis H0: p1 = .25, p2 = .2, p3 = .3, p4 = .25, where p1 =
The report €œFatality Facts 2004: Bicycles€ (Insurance Institute, 2004) included the following table classifying 715 fatal bicycle accidents according to time of day the accident occurred.a. Assume it is reasonable to regard the 715 bicycle accidents summarized in the table as a random
The article “You Will Be Tested on This” (The Chronicle of Higher Education, June 8, 2007) describes an experiment to investigate the effect of quizzes on student learning. The goal of the experiment was to determine if students who take daily quizzes have better end of- semester retention than
Many people take ginkgo supplements advertised to improve memory. Are these over-the-counter supplements effective? In a study reported in the paper €œGinkgo for Memory Enhancement€ (Journal of the American Medical Association [2002]: 835€“ 840), elderly adults were assigned at random to
The Harvard University Institute of Politics surveys undergraduates across the United States annually. Responses to the question €œWhen it comes to voting, do you consider yourself to be affiliated with the Democratic Party, the Republican Party, or are you Independent or unaffiliated
The survey described in the previous exercise also asked the following question: €œPlease tell me whether you trust the President to do the right thing all of the time, most of the time, some of the time, or never. Use the data in the given table and an appropriate hypothesis test to
The report €œUndergraduate Students and Credit Cards in 2004€ (Nellie Mae, May 2005) included information collected from individuals in a random sample of undergraduate students in the United States. Students were classified according to region of residence and whether or not
The report described in the previous exercise also classified students according to region of residence and whether or not they had a credit card with a balance of more than $7000. Do these data support the conclusion that there is an association between region of residence and whether or not the
The discharge of industrial wastewater into rivers affects water quality. To assess the effect of a particular power plant on water quality, 24 water specimens were taken 16 km upstream and 4 km downstream of the plant. Alkalinity (mg/L) was determined for each specimen, resulting in the summary
The report of a European commission on radiation protection titled €œCosmic Radiation Exposure of Aircraft Crew€ (2004) measured the exposure to radiation on eight international flights from Madrid using several different methods for measuring radiation. Data for two of the methods are given
It is hypothesized that when homing pigeons are disoriented in a certain manner, they will exhibit no preference for any direction of flight after takeoff. To test this, 120 pigeons are disoriented and released, and the direction of flight of each is recorded. The resulting data are given in the
The authors of the paper “Inadequate Physician Knowledge of the Effects of Diet on Blood Lipids and Lipoproteins” (Nutrition Journal [2003]: 19– 26) summarize the responses to a questionnaire on basic knowledge of nutrition that was mailed to 6000 physicians selected at random from a list of
The paper “Pistachio Nut Consumption and Serum Lipid Levels” (Journal of the American College of Nutrition [2007]: 141–148) describes a study to determine if eating pistachio nuts can have an effect on blood cholesterol levels in people with high cholesterol. Fifteen subjects followed their
The article €œFines Show Airline Problems€ (USA Today, February 2, 2010) gave the accompanying data on the number of fines for violating FAA maintenance regulations assessed against each of the 25 U.S. airlines from 2004 to 2009.a. Construct a boxplot of these data. Are any of the
The article “Odds Are, It’s Wrong” (Science News, March 27, 2010) poses the following scenario: Suppose that a test for steroid use among baseball players is 95% accurate—that is, it correctly identifies actual steroid users 95% of the time, and misidentifies non-users as users = percent of
The press release “Luxury or Necessity? The Public Makes a U-Turn” (Pew Research Center, April 23, 2009) summarizes results from a survey of a nationally representative sample of n = 1003 adult Americans. a. One question in the survey asked participants if they think of a landline phone as a
The following quote describing 18- to 29-yearolds is from the article €œStudy: Millennial Generation More Educated, Less Employed€ (USA Today, February 23, 2010): €œ38% have a tattoo (and half of those with tattoos have two to five; 18% have six or more).€ These percentages were based
To raise revenues, many airlines now charge fees to check luggage. Suppose that the number of checked bags was recorded for each person in a random sample of 100 airline passengers selected before fees were imposed and also for each person in a random sample of 100 airline passengers selected after
Consider the following data on y = number of songs stored on an MP3 player and x = number of months the user has owned the MP3 player for a sample of 15 owners of MP3 players.a. Construct a scatterplot of the data. Does the relationship between x and y look approximately linear?b. What is the
Let x be the size of a house (in square feet) and y be the amount of natural gas used (therms) during a specified period. Suppose that for a particular community, x and y are related according to the simple linear regression model with b = slope of population regression line = .017 a = y intercept
A simple linear regression model was used to describe the relationship between y = hardness of molded plastic and x = amount of time elapsed since the end of the molding process. Summary quantities included n 5 15, SSResid = 1235.470, and SSTo = 25,321.368.a. Calculate a point estimate of s. On how
Consider the accompanying data on x = advertising share and y = market share for a particular brand of soft drink during 10 randomly selected years.a. Construct a scatterplot for these data. Do you think the simple linear regression model would be appropriate for describing the relationship between
What is the difference between s and sb? What is the difference between sb and sb?
Suppose that a single y observation is made at each of the x values 5, 10, 15, 20, and 25.a. If s = 4, what is the standard deviation of the statistic b?b. Now suppose that a second observation is made at every x value listed in Part (a) (for a total of 10 observations). Is the resulting value of
Refer back to Example 13. 3 in which the simple linear regression model was fit to data on x = proportion who judged candidate A as more competent and y 5 vote difference proportion. For the purpose of estimating b as accurately as possible, would it have been preferable to have observations with x
Exercise 13. 10 presented y = hardness of molded plastic and x = time elapsed since the molding was completed. Summary quantities includeda. Calculate the estimated standard deviation of the statisticb. Obtain a 95% confidence interval for b, the slope of the population regression line.c. Does the
A simple linear regression model was used to describe the relationship between sales revenue y (in thousands of dollars) and advertising expenditure x (also in thousands of dollars) for fast-food outlets during a 3-month period. A sample of 15 outlets yielded the accompanying summary quantities.a.
An experiment to study the relationship between x = time spent exercising (minutes) and y 5 amount of oxygen consumed during the exercise period resulted in the following summary statistics.a. Estimate the slope and y intercept of the population regression line. b. One sample observation on oxygen
The paper €œThe Effects of Split Keyboard Geometry on Upper Body Postures€ (Ergonomics [2009]: 104€“111) describes a study to determine the effects of several keyboard characteristics on typing speed. One of the variables considered was the front-to-back surface angle
The authors of the paper €œDecreased Brain Volume in Adults with Childhood Lead Exposure€ (Public Library of Science Medicine [May 27, 2008]: e112) studied the relationship between childhood environmental lead exposure and a measure of brain volume change in a particular region
The flow rate in a device used for air quality measurement depends on the pressure drop x (inches of water) across the device’s filter. Suppose that for x values between = and 20, these two variables are related according to the simple linear regression model with population regression line y =
Do taller adults make more money? The authors of the paper “Stature and Status: Height, Ability, and Labor Market Outcomes” (Journal of Political Economics [2008]: 499–532) investigated the association between height and earnings. They used the simple linear regression model to describe the
Researchers studying pleasant touch sensations measured the firing frequency (impulses per second) of nerves that were stimulated by a light brushing stroke on the forearm and also recorded the subject€™s numerical rating of how pleasant the sensation was. The accompanying data was read from a
The accompanying data were read from a plot (and are a subset of the complete data set) given in the article €œCognitive Slowing in Closed-Head Injury€ (Brain and Cognition [1996]: 429€“ 440). The data represent the mean response times for a group of individuals with closed-head injury
Exercise 13. 16 described a regression analysis in which y = sales revenue and x = advertising expenditure. Summary quantities given there yielda. Test the hypothesis H0: b = 0 versus Ha: b = 0 using a significance level of .05. What does your conclusion say about the nature of the relationship
Consider the accompanying data on x = research and development expenditure (thousands of dollars) and y = growth rate (% per year) for eight different industries.a. Would a simple linear regression model provide useful information for predicting growth rate from research and development
The article €œEffect of Temperature on the pH of Skim Milk€ (Journal of Dairy Research [1988]: 277€“ 280) reported on a study involving x = temperature (8C) under specified experimental conditions and y = milk pH. The accompanying data (read from a graph) are a representative subset of
In anthropological studies, an important characteristic of fossils is cranial capacity. Frequently skulls are at least partially decomposed, so it is necessary to use other characteristics to obtain information about capacity. One such measure that has been used is the length of the
Exercise 13. 21 gave data on x = nerve firing frequency and y = pleasantness rating when nerves were stimulated by a light brushing stoke on the forearm. The x values and the corresponding residuals from a simple linear regression are as follows:a. Construct a standardized residual plot. Does the
Sea bream are one type of fish that are often raised in large fish farming enterprises. These fish are usually fed a diet consisting primarily of fish meal. The authors of the paper €œGrowth and Economic Profit of Gilthead Sea Bream (Sparus aurata, L.) Fed Sunflower Meal€
The article €œVital Dimensions in Volume Perception: Can the Eye Fool the Stomach?€ (Journal of Marketing Research [1999]: 313€“ 326) gave the accompanying data on the dimensions of 27 representative food products (Gerber baby food, Cheez Whiz, Skippy Peanut Butter, and Ahmed€™s
The paper “Predicting Yolk Height, Yolk Width, Albumen Length, Eggshell Weight, Egg Shape Index, Eggshell Thickness, Egg Surface Area of Japanese Quails Using Various Egg Traits as Regressors” (International Journal of Poultry Science [2008]: 85–88) suggests that the simple linear regression
The authors of the article €œAge, Spacing and Growth Rate of Tamarix as an Indication of Lake Boundary Fluctuations at Sebkhet Kelbia, Tunisia€ (Journal of Arid Environments [1982]: 43€“ 51) used a simple linear regression model to describe the relationship between y
Carbon aerosols have been identified as a contributing factor in a number of air quality problems. In a chemical analysis of diesel engine exhaust, x = mass (mg/cm2) and y = elemental carbon (mg/cm2) were recorded (“Comparison of Solvent Extraction and Thermal Optical Carbon Analysis Methods:
An investigation of the relationship between x = traffic flow (thousands of cars per 24 hours) and y 5 lead content of bark on trees near the highway (mg/g dry weight) yielded the accompanying data. A simple linear regression model was fit, and the resulting estimated regression line was y^ = 28.7
Explain the difference between a confidence interval and a prediction interval. How can a prediction level of 95% be interpreted?
Suppose that a regression data set is given and you are asked to obtain a confidence interval. How would you tell from the phrasing of the request whether the interval is for b or for a 1 b*?
In Exercise 13. 17, we considered a regression of y = oxygen consumption on x = time spent exercising. Summary quantities given there yielda. Calculate sa1b12.02, the estimated standard deviation of the statistic a 1 b(2.0).b. Without any further calculation, what is sa1b(3.0) and what reasoning
Example 13. 3 gave data on x = proportion who judged candidate A as more competent and y = vote difference proportion. Calculate a 95% confidence interval for the mean vote-difference proportion for congressional races where 60% judge candidate A as more competent.
The data of Exercise13. 25, in which x = milk temperature and y = milk pH, yielda. Obtain a 95% confidence interval for a 1 b(40), the mean milk pH when the milk temperature is 408C. b. Calculate a 99% confidence interval for the mean milk pH when the milk temperature is 358C. c. Would you
Return to the regression of y = milk pH on x 5 milk temperature described in the previous exercise. a. Obtain a 95% prediction interval for a single pH observation to be made when milk temperature = 408C. b. Calculate a 99% prediction interval for a single pH observation when milk temperature =
A subset of data read from a graph that appeared in the paper €œDecreased Brain Volume in Adults with Childhood Lead Exposure€ (Public Library of Science Medicine [May 27, 2008]: e112) was used to produce the following Minitab output, where x = mean childhood blood lead level
A sample of small cars was selected, and the values of x = horsepower and y = fuel efficiency (mpg) were determined for each car. Fitting the simple linear regression model gave the estimated regression equation y^ = 44.0 2 .150x. a. How would you interpret b = 2.150? b. Substituting x = 100 gives
An experiment was carried out by geologists to see how the time necessary to drill a distance of 5 feet in rock ( y, in minutes) depended on the depth at which the drilling began (x, in feet, between 0 and 400). We show part of the Minitab output obtained from fitting the simple linear regression
According to €œReproductive Biology of the Aquatic Salamander Amphiuma tridactylum in Louisiana€ (Journal of Herpetology [1999]: 100€“ 105), the size of a female salamander€™s snout is correlated with the number of eggs in her clutch. The following data are consistent with summary
The article first introduced in Exercise 13. 29 of Section 13. 3 gave data on the dimensions of 27 representative food products.a. Use the data set given there to test the hypothesis that there is a positive linear relationship between x = minimum width and y = maximum width of an object.b.
The shelf life of packaged food depends on many factors. Dry cereal is considered to be a moisturesensitive product (no one likes soggy cereal!) with the shelf life determined primarily by moisture content. In a study of the shelf life of one particular brand of cereal, x = time on shelf (days
For the cereal data of the previous exercise, the mean x value is 19.21. Would a 95% confidence interval with x* = 20 or x* = 17 be wider? Explain. Answer the same question for a prediction interval.
A regression of x = tannin concentration (mg/L) and y = perceived astringency score was considered in Examples 5.2 and 5.6. The perceived astringency was computed from expert tasters rating a wine on a scale from 0 to 10 and then standardizing the rating by computing a z-score. Data for 32 red
The article €œPerformance Test Conducted for a Gas Air-Conditioning System€ (American Society of Heating, Refrigerating, and Air Conditioning Engineering [1969]: 54) reported the following data on maximum outdoor temperature (x) and hours of chiller operation per day (y) for a 3-ton
If the sample correlation coefficient is equal to 1, is it necessarily true that r = 1? If r = 1, is it necessarily true that r = 1?
A sample of n = 353 college faculty members was obtained, and the values of x = teaching evaluation index and y = annual raise were determined (“Determination of Faculty Pay: An Agency Theory Perspective,” Academy of Management Journal [1992]: 921– 955). The resulting value of r was .11. Does
Suppose that a simple linear regression model is appropriate for describing the relationship between y 5 house price (in dollars) and x = house size (in square feet) for houses in a large city. The population regression line is y = 23,000 + 47x and s = 5000. a. What is the average change in price
It seems plausible that higher rent for retail space could be justified only by a higher level of sales. A random sample of n = 53 specialty stores in a chain was selected, and the values of x = annual dollar rent per square foot and y = annual dollar sales per square foot were determined,
Television is regarded by many as a prime culprit for the difficulty many students have in performing well in school. The article “The Impact of Athletics, Part- Time Employment, and Other Activities on Academic Achievement” (Journal of College Student Development [1992]: 447– 453) reported
The accompanying summary quantities for x 5 particulate pollution (mg/m3) and y = luminance (.01 cd/ m2) were calculated from a representative sample of data that appeared in the article €œLuminance and Polarization of the Sky Light at Seville (Spain) Measured in White Light€ (Atmospheric
In a study of bacterial concentration in surface and subsurface water (€œPb and Bacteria in a Surface Microlayer€ Journal of Marine Research [1982]: 1200€“ 1206), the accompanying data were obtained.Summary quantities are Using a significance level of .05, determine whether the data
A sample of n = 10,000 (x, y) pairs resulted in r = .022. Test H0: r = 0 versus Ha: r = 0 at significance level .05. Is the result statistically significant? Comment on the practical significance of your analysis.
The paper €œStature and Status: Height, Ability, and Labor Market Outcomes€ (Journal of Political Economy [2008]: 499€“532) describes a study of the association between height and cognitive ability. The paper states: €œWe first regress individual test scores
The effects of grazing animals on grasslands have been the focus of numerous investigations by ecologists. One such study, reported in “The Ecology of Plants, Large Mammalian Herbivores, and Drought in Yellowstone National Park” (Ecology [1992]: 2043– 2058), proposed using the simple linear
A random sample of n = 347 students was selected, and each one was asked to complete several questionnaires, from which a Coping Humor Scale value x and a Depression Scale value y were determined (“Depression and Sense of Humor,” (Psychological Reports [1994]: 1473– 1474). The resulting value
Example 13. 4 gave data on x = treadmill run time to exhaustion and y = 20-km ski time for a sample of 11 biathletes. Use the accompanying Minitab output to answer the following questions.a. Carry out a test at significance level .01 to decide whether the simple linear regression model is
A sample of n = 61 penguin burrows was selected, and values of both y = trail length (m) and x 5 soil hardness (force required to penetrate the substrate to a depth of 12 cm with a certain gauge, in kg) were determined for each one (“Effects of Substrate on the Distribution of Magellanic Penguin
a. Explain the difference between the line y = a + bx and the line y^ = a+1 bx. b. Explain the difference between b and b. c. Let x* denote a particular value of the independent variable. Explain the difference between a1 bx* and a + bx*. d. Explain the difference between s and se.
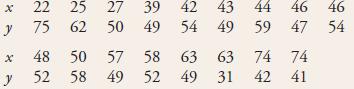
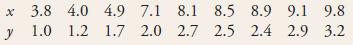
The article €œPhotocharge Effects in Dye Sensitized Ag[Br,I] Emulsions at Millisecond Range Exposures€ (Photographic Science and Engineering [1981]: 138€“ 144) gave the accompanying data on x = % light absorption and y = peak photovoltage.a. Construct a scatterplot of the data. What does
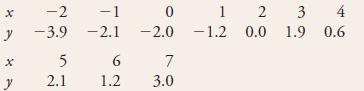
Reduced visual performance with increasing age has been a much-studied phenomenon in recent years. This decline is due partly to changes in optical properties of the eye itself and partly to neural degeneration throughout the visual system. As one aspect of this problem, the article “Morphometry
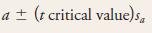
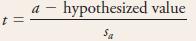
Occasionally an investigator may wish to compute a confidence interval for a, the y intercept of the true regression line, or test hypotheses about a. The estimated y intercept is simply the height of the estimated line when x = 0, since a 1 b(0) = a. This implies that sa the estimated standard
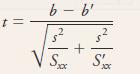
In some studies, an investigator has n (x, y) pairs sampled from one population and m (x, y) pairs from a second population. Let b and br denote the slopes of the first and second population lines, respectively, and let b and b’ denote the estimated slopes calculated from the first and second
Showing 34100 - 34200
of 88243
First
335
336
337
338
339
340
341
342
343
344
345
346
347
348
349
Last
Step by Step Answers
.png)
.png)
.png)
.png)
.png)
.png)
.png)
.png)
.png)
.png)
.png)
.png)
.png)
.png)
.png)
.png)
.png)
-1.png)
-2.png)
-3.png)
.png)
![The paper €œSociochemosensory and Emotional Functions€ (Psychological Science [2009]: 1118€“1124)](https://dsd5zvtm8ll6.cloudfront.net/si.question.images/image/images8/536-M-S-O-T-P(1262).png)
.png)
.png)
.png)
.png)
.png)
.png)
.png)
.png)
.png)
.png)
.png)
.png)
.png)
.png)
.png)
.png)
.png)
.png)
.png)
.png)
.png)
.png)
-1.png)
-2.png)
.png)
-1.png)
-2.png)
-1.png)
-2.png)
-1.png)
-2.png)
.png)
.png)
.png)
.png)
.png)
-1.png)
-2.png)
-1.png)
-2.png)
.png)
-1.png)
-2.png)
.png)
-1.png)
-2.png)
.png)


![The article €œPhotocharge Effects in Dye Sensitized Ag[Br,I] Emulsions at](https://dsd5zvtm8ll6.cloudfront.net/si.question.images/image/images8/536-M-S-L-R(4281)-1.png)